Shopify is a popular ecommerce platform used by over 5.5 million sellers.
Founded in 2006, Shopify surpassed $1 billion in gross merchandise volume (GMV) in 2013. Today, they have processed $292.28 billion in ecommerce sales in 2024 alone. The company has also generated $8.88 billion in revenue in 2024.
675 million buyers place an order with Shopify merchants each year. That’s a 2.25x increase since 2019.
Continue reading to find all of the latest Shopify statistics in 2026:
- Shopify Top Stats
- How Many Shopify Stores Are There?
- Shopify Merchants
- Shopify Merchants by Region
- Shopify Gross Merchandise Volume
- How Many People Buy from Shopify Stores?
- Shopify Revenue
- Shopify Subscription Solutions Revenue
- Shopify Merchant Solutions Revenue
- Shopify Revenue by Region
- Shopify Monthly Recurring Revenue
- Number of Apps on the Shopify App Store
- What’s the Shopify Market Share?
- How Many People Work at Shopify?
Shopify Top Stats
- It is estimated that more than 5.5 million merchants sell using the Shopify platform.
- Shopify brought in $8.88 billion in revenue in 2024.
- Shopify claims a 12% ecommerce market share in the US and 8% in Western Europe.
- The Shopify App Store contains 13,000 apps.
- Shopify merchants had a total of 675 million buyers in 2023.
How Many Shopify Stores Are There?
6.87 million live websites use Shopify. The majority of domains (54.4%) are registered in the United States. The United Kingdom and Germany complete the top 3.

Here’s a breakdown of Shopify online stores by country:
| Country | Live Stores Using Shopify |
|---|---|
| United States | 3,735,921 |
| United Kingdom | 244,936 |
| Germany | 191,655 |
| Australia | 171,631 |
| Canada | 137,363 |
| India | 136,646 |
| France | 122,746 |
| Colombia | 107,503 |
| Netherlands | 94,172 |
| Brazil | 79,332 |
Shopify has a dedicated plan for enterprise customers, called Shopify Plus. This starts from $2,500 per month.
80,279 live websites use Shopify Plus. 53.6% of Shopify Plus customers are based in the United States.

Here’s a breakdown of Shopify Plus users by country:
| Country | Live stores using Shopify Plus |
|---|---|
| United States | 43,030 |
| Canada | 6,205 |
| United Kingdom | 5,741 |
| Australia | 4,398 |
| Germany | 2,935 |
| France | 1,713 |
| Netherlands | 1,490 |
| Denmark | 1,201 |
| Italy | 903 |
| India | 858 |
Source: BuiltWith
Shopify Merchants
According to the last update, Shopify had 2.06 million merchants in December 2021.
Since then, the company stopped reporting the exact count of Shopify merchants and claims the platform is used by “millions of merchants”.
The latest estimates have the figure at upwards of 5.5 million.
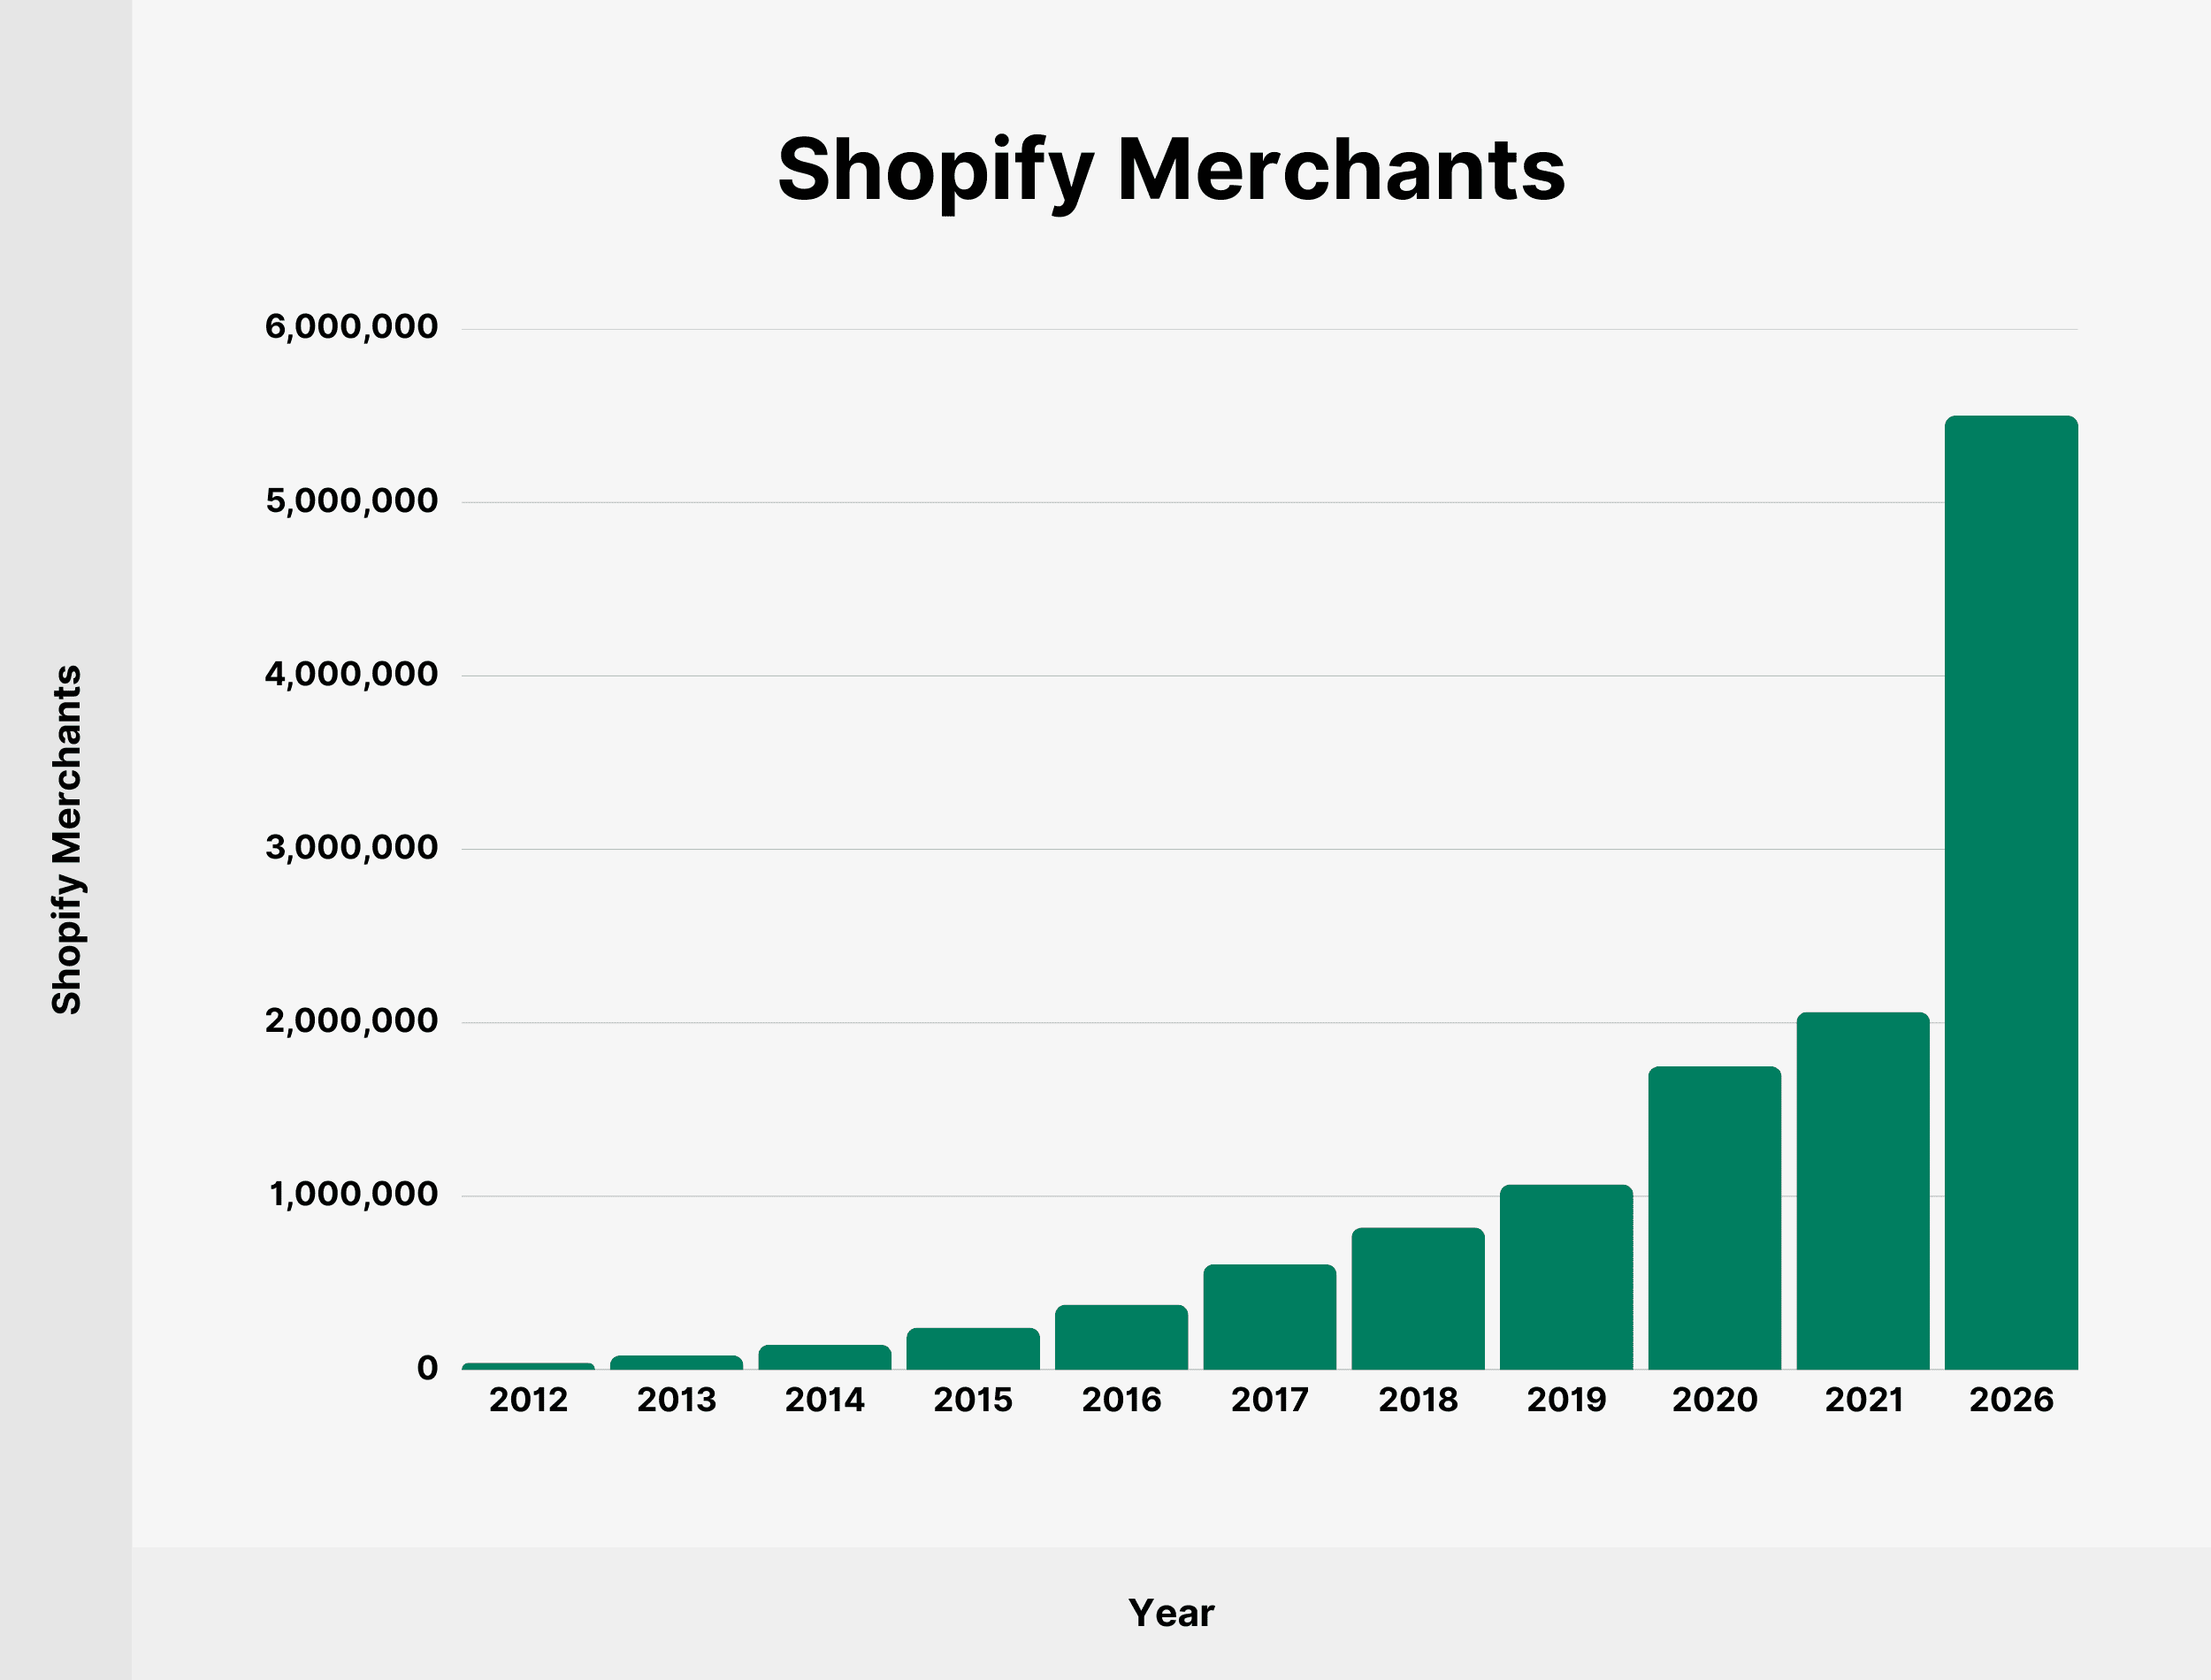
Here’s a table with the number of merchants using Shopify since 2012:
| Year | Shopify Merchants |
|---|---|
| 2012 | 41,000 |
| 2013 | 84,000 |
| 2014 | 145,000 |
| 2015 | 243,000 |
| 2016 | 375,000 |
| 2017 | 609,000 |
| 2018 | 820,000 |
| 2019 | 1,069,000 |
| 2020 | 1,749,000 |
| 2021 | 2,063,000 |
| 2026* | 5,500,000+ |
Sources: Shopify, Craftberry
Shopify Merchants by Region
Shopify has merchants located in 175 countries across the world.

In over 65 countries, Shopify’s gross merchandise volume exceeds $100 million, up from 29 countries in 2019.
As of December 2023, 54% of all Shopify merchants were based in North America.
A further 25% of Shopify merchants were located in Europe, the Middle East, and Africa.
Here’s a regional breakdown of Shopify merchants in 2023:
| Region | Share |
|---|---|
| North America | 54% |
| Europe, the Middle East, and Africa | 27% |
| Asia Pacific, Australia, and China | 14% |
| Latin America (Mexico and South America) | 5% |
Source: Shopify
Shopify Gross Merchandise Volume
Shopify facilitated $292.28 billion worth of transactions in 2024. That’s an increase of 23.89% on Shopify’s 2023 gross merchandise volume (GMV).
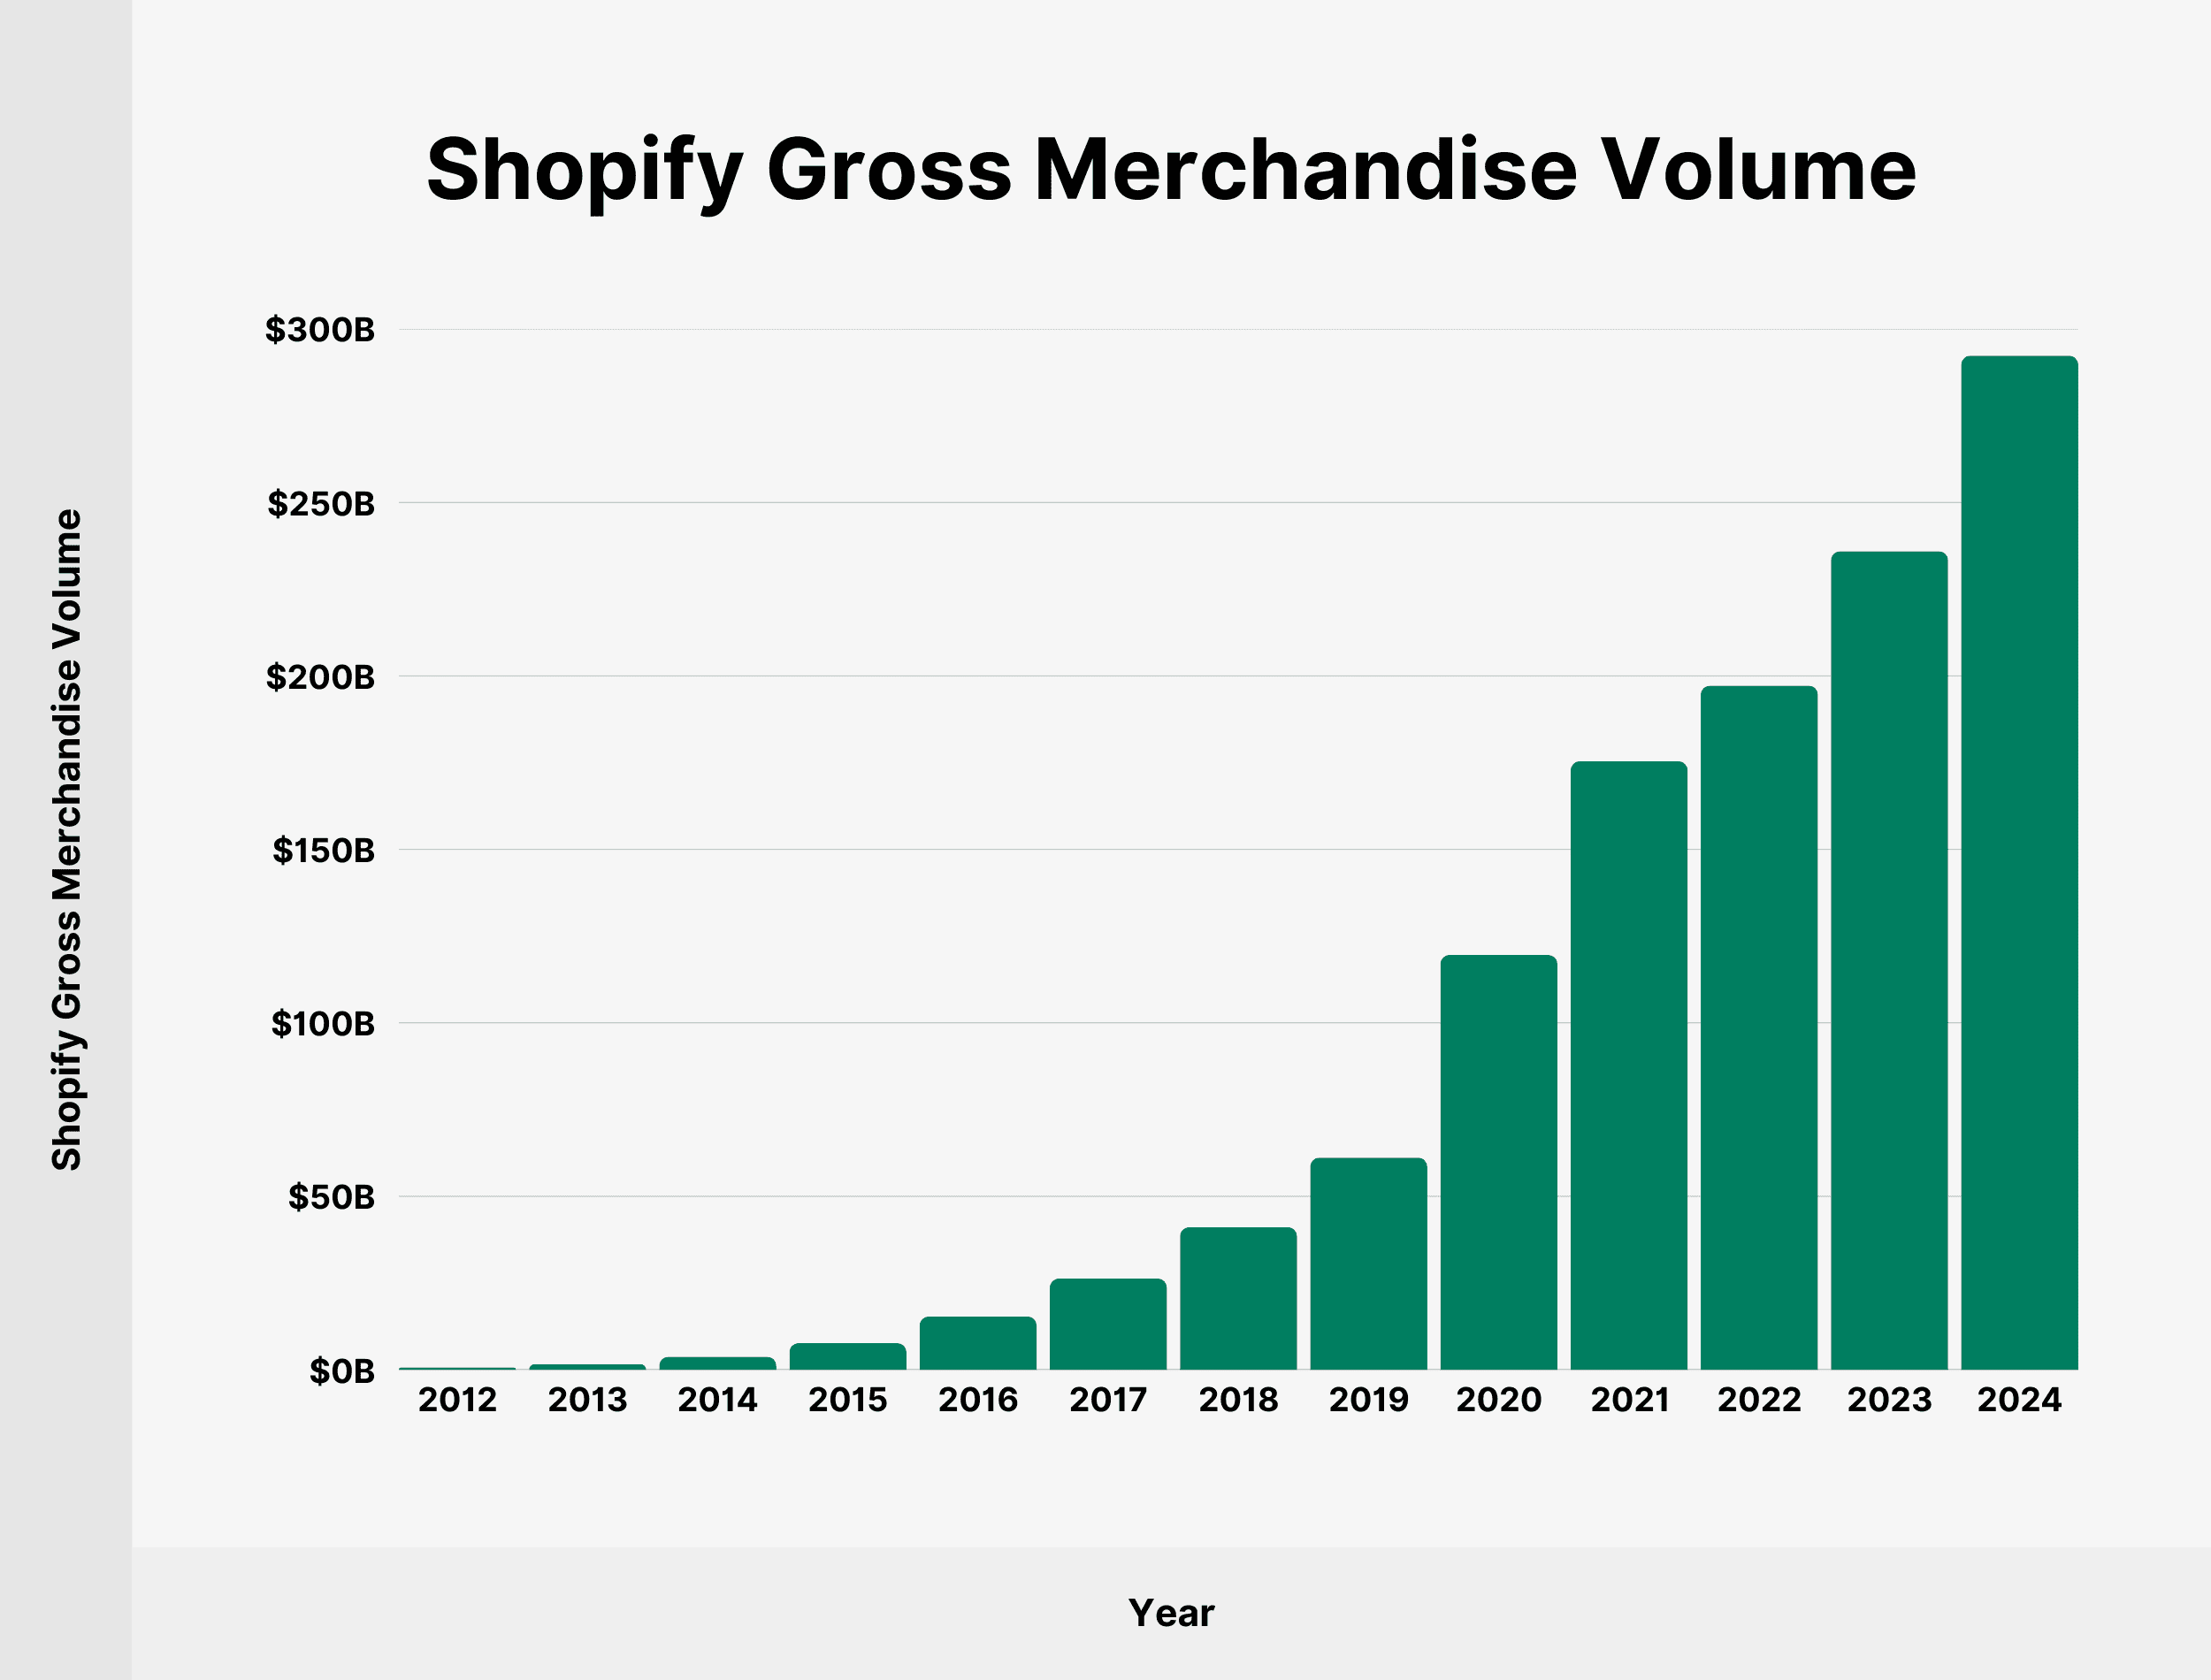
We’ve charted Shopify’s gross merchandise volume since 2012:
| Year | Shopify Gross Merchandise Volume |
|---|---|
| 2012 | $707.4 million |
| 2013 | $1.62 billion |
| 2014 | $3.76 billion |
| 2015 | $7.7 billion |
| 2016 | $15.37 billion |
| 2017 | $26.32 billion |
| 2018 | $41.1 billion |
| 2019 | $61.14 billion |
| 2020 | $119.58 billion |
| 2021 | $175.36 billion |
| 2022 | $197.17 billion |
| 2023 | $235.91 billion |
| 2024 | $292.28 billion |
Source: Shopify
How Many People Buy from Shopify Stores?
675 million people bought from stores on Shopify in 2023. The number of shoppers placing an order with Shopify merchants has increased by 47.7% since 2020.

Here’s a table showing the number of buyers from Shopify stores since 2014:
| Year | Shopify Buyers |
|---|---|
| 2014 | 28 million |
| 2015 | 57 million |
| 2016 | 100 million |
| 2017 | 163 million |
| 2018 | 216 million |
| 2019 | 300 million |
| 2020 | 457 million |
| 2022 | 561 million |
| 2023 | 675 million |
Source: Shopify
Shopify Revenue
Shopify generated $8.88 billion in 2024. This is an increase of 25.78% year over year.
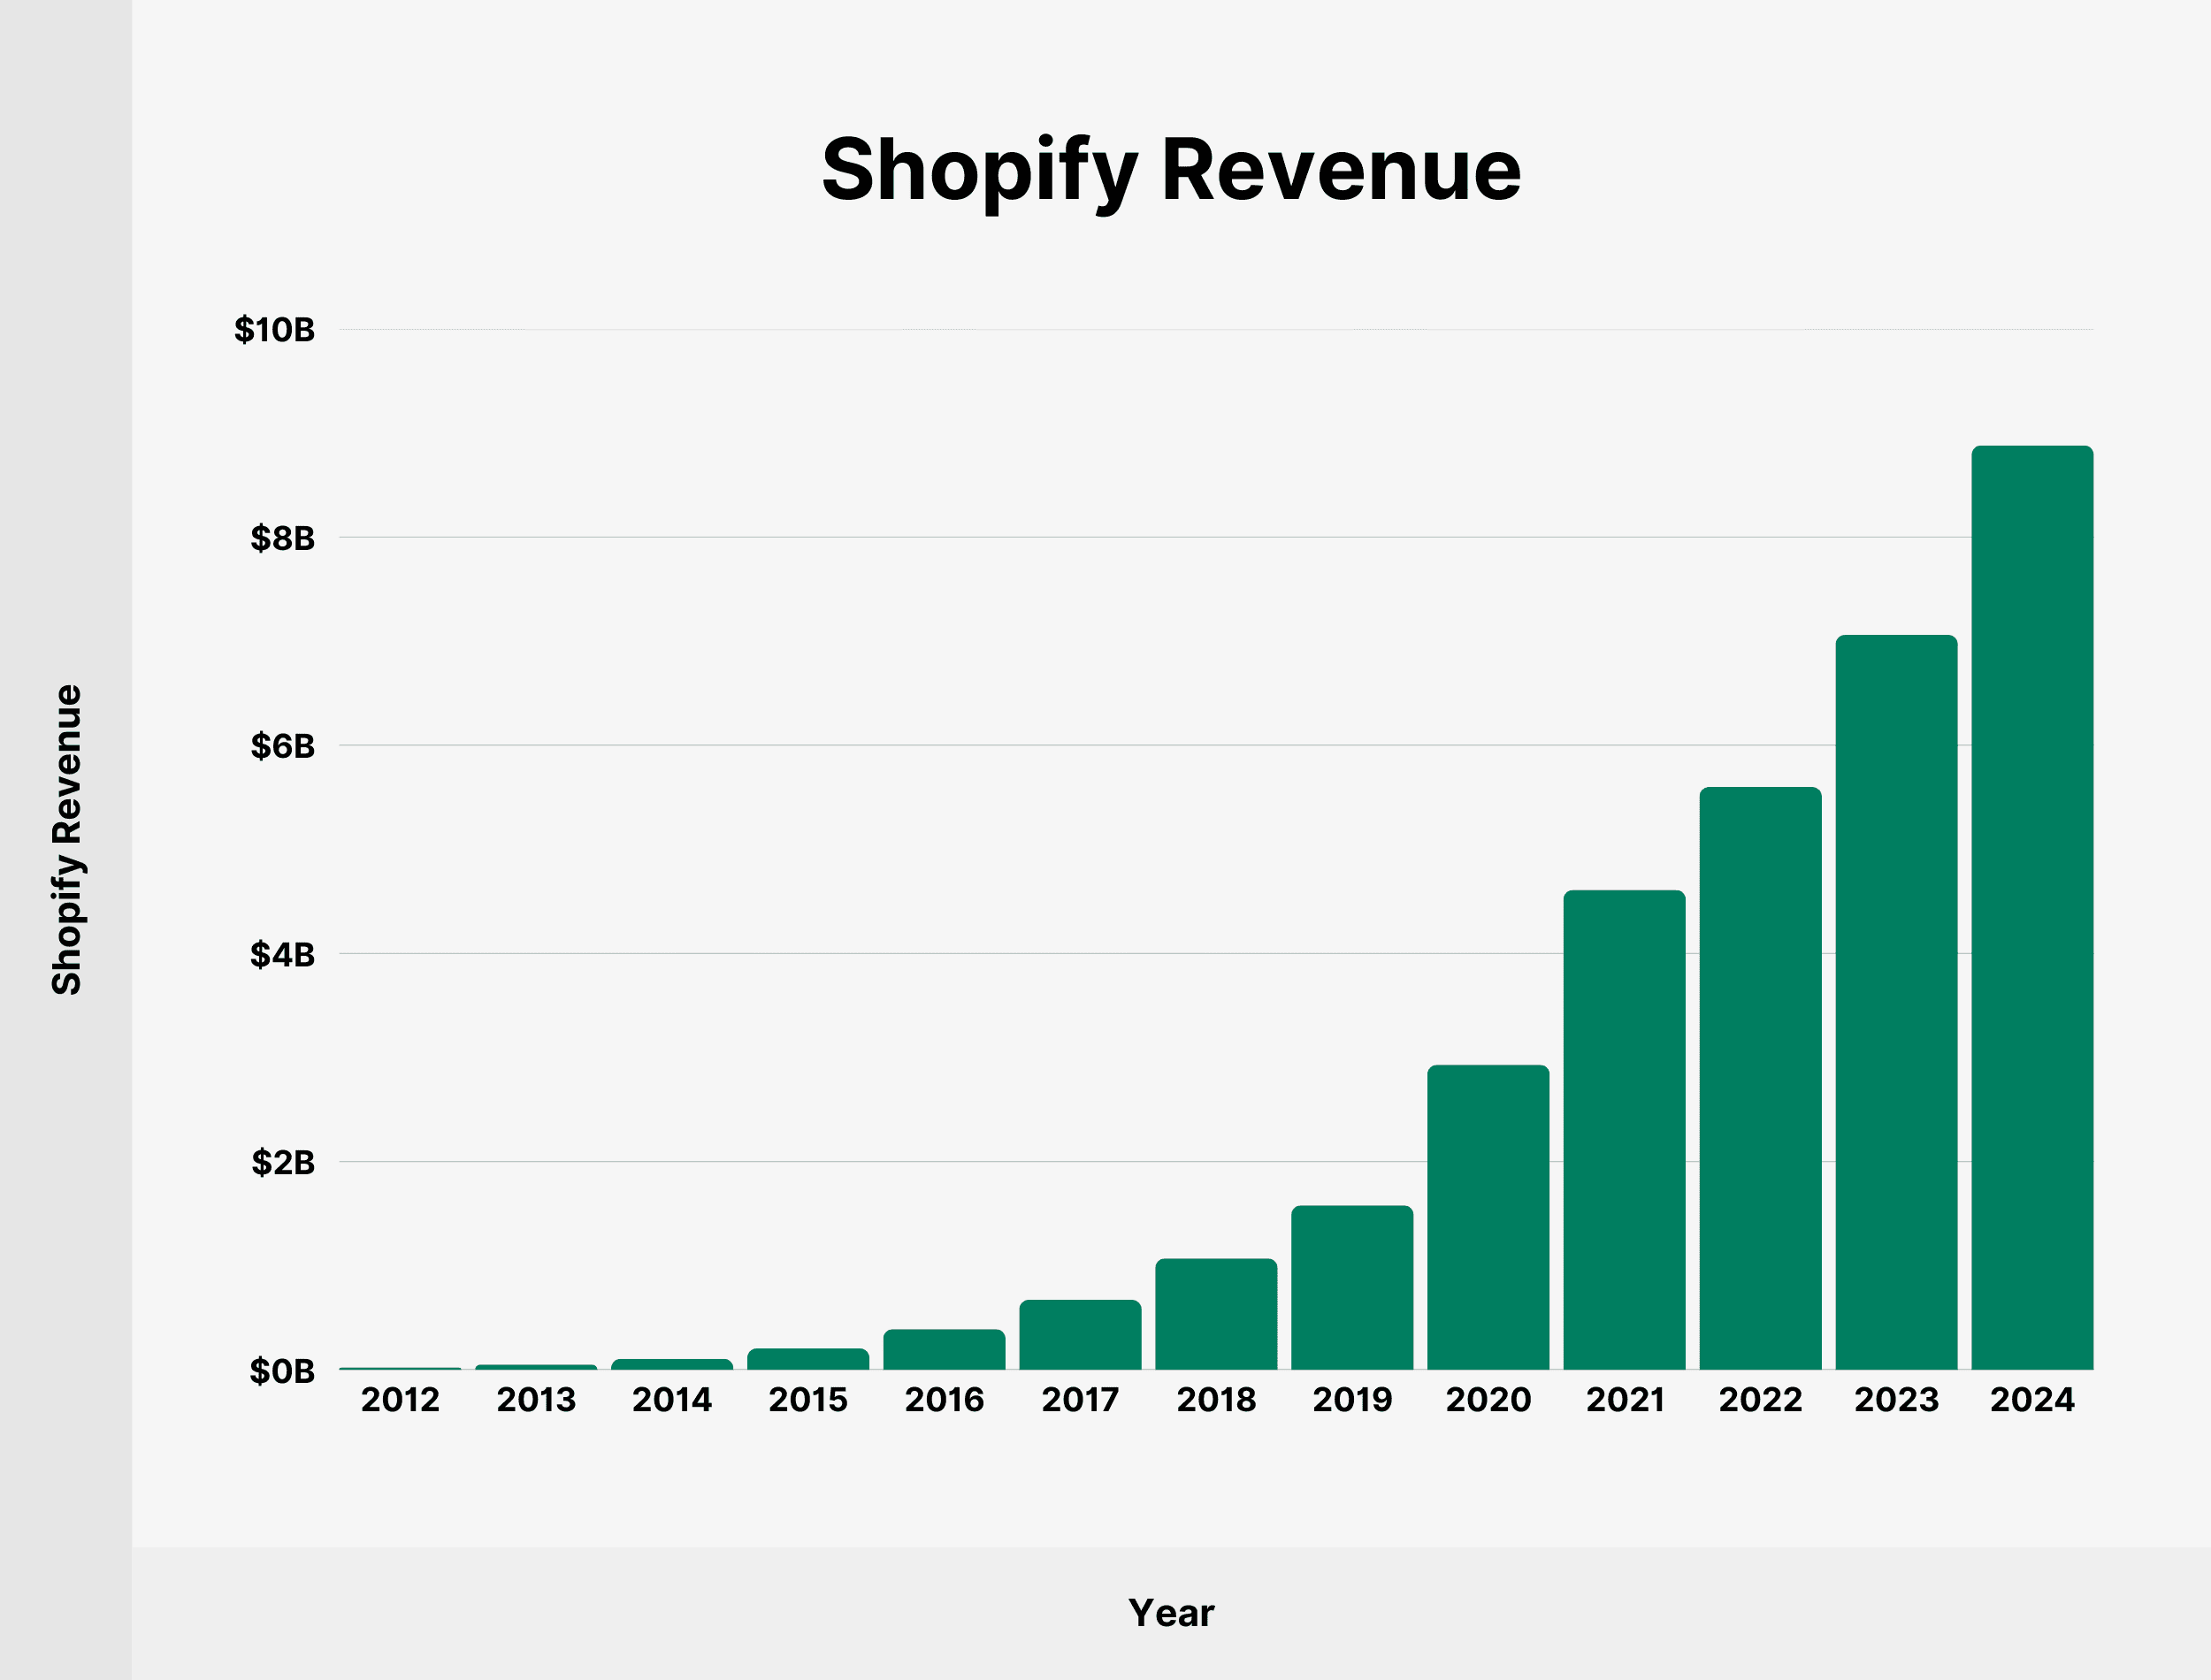
Shopify’s annual revenue has increased by over 8x from 2018 to 2024.
Here’s a table with complete data on Shopify revenue since 2012:
| Year | Shopify Revenue |
|---|---|
| 2012 | $23.71 million |
| 2013 | $50.25 million |
| 2014 | $105.02 million |
| 2015 | $205.23 million |
| 2016 | $389.33 million |
| 2017 | $673.3 million |
| 2018 | $1.07 billion |
| 2019 | $1.58 billion |
| 2020 | $2.93 billion |
| 2021 | $4.61 billion |
| 2022 | $5.6 billion |
| 2023 | $7.06 billion |
| 2024 | $8.88 billion |
Source: Shopify
Shopify Subscription Solutions Revenue
Shopify regularly reports its “subscription solutions” revenue. The category includes platform subscription fees and Point-Of-Sale Pro fees, as well as sales of apps, themes, and domains.
Shopify brought in $2.35 billion in subscription revenue in 2024. This accounts for 26.7% of total company revenue and shows a 27.93% growth rate year over year.
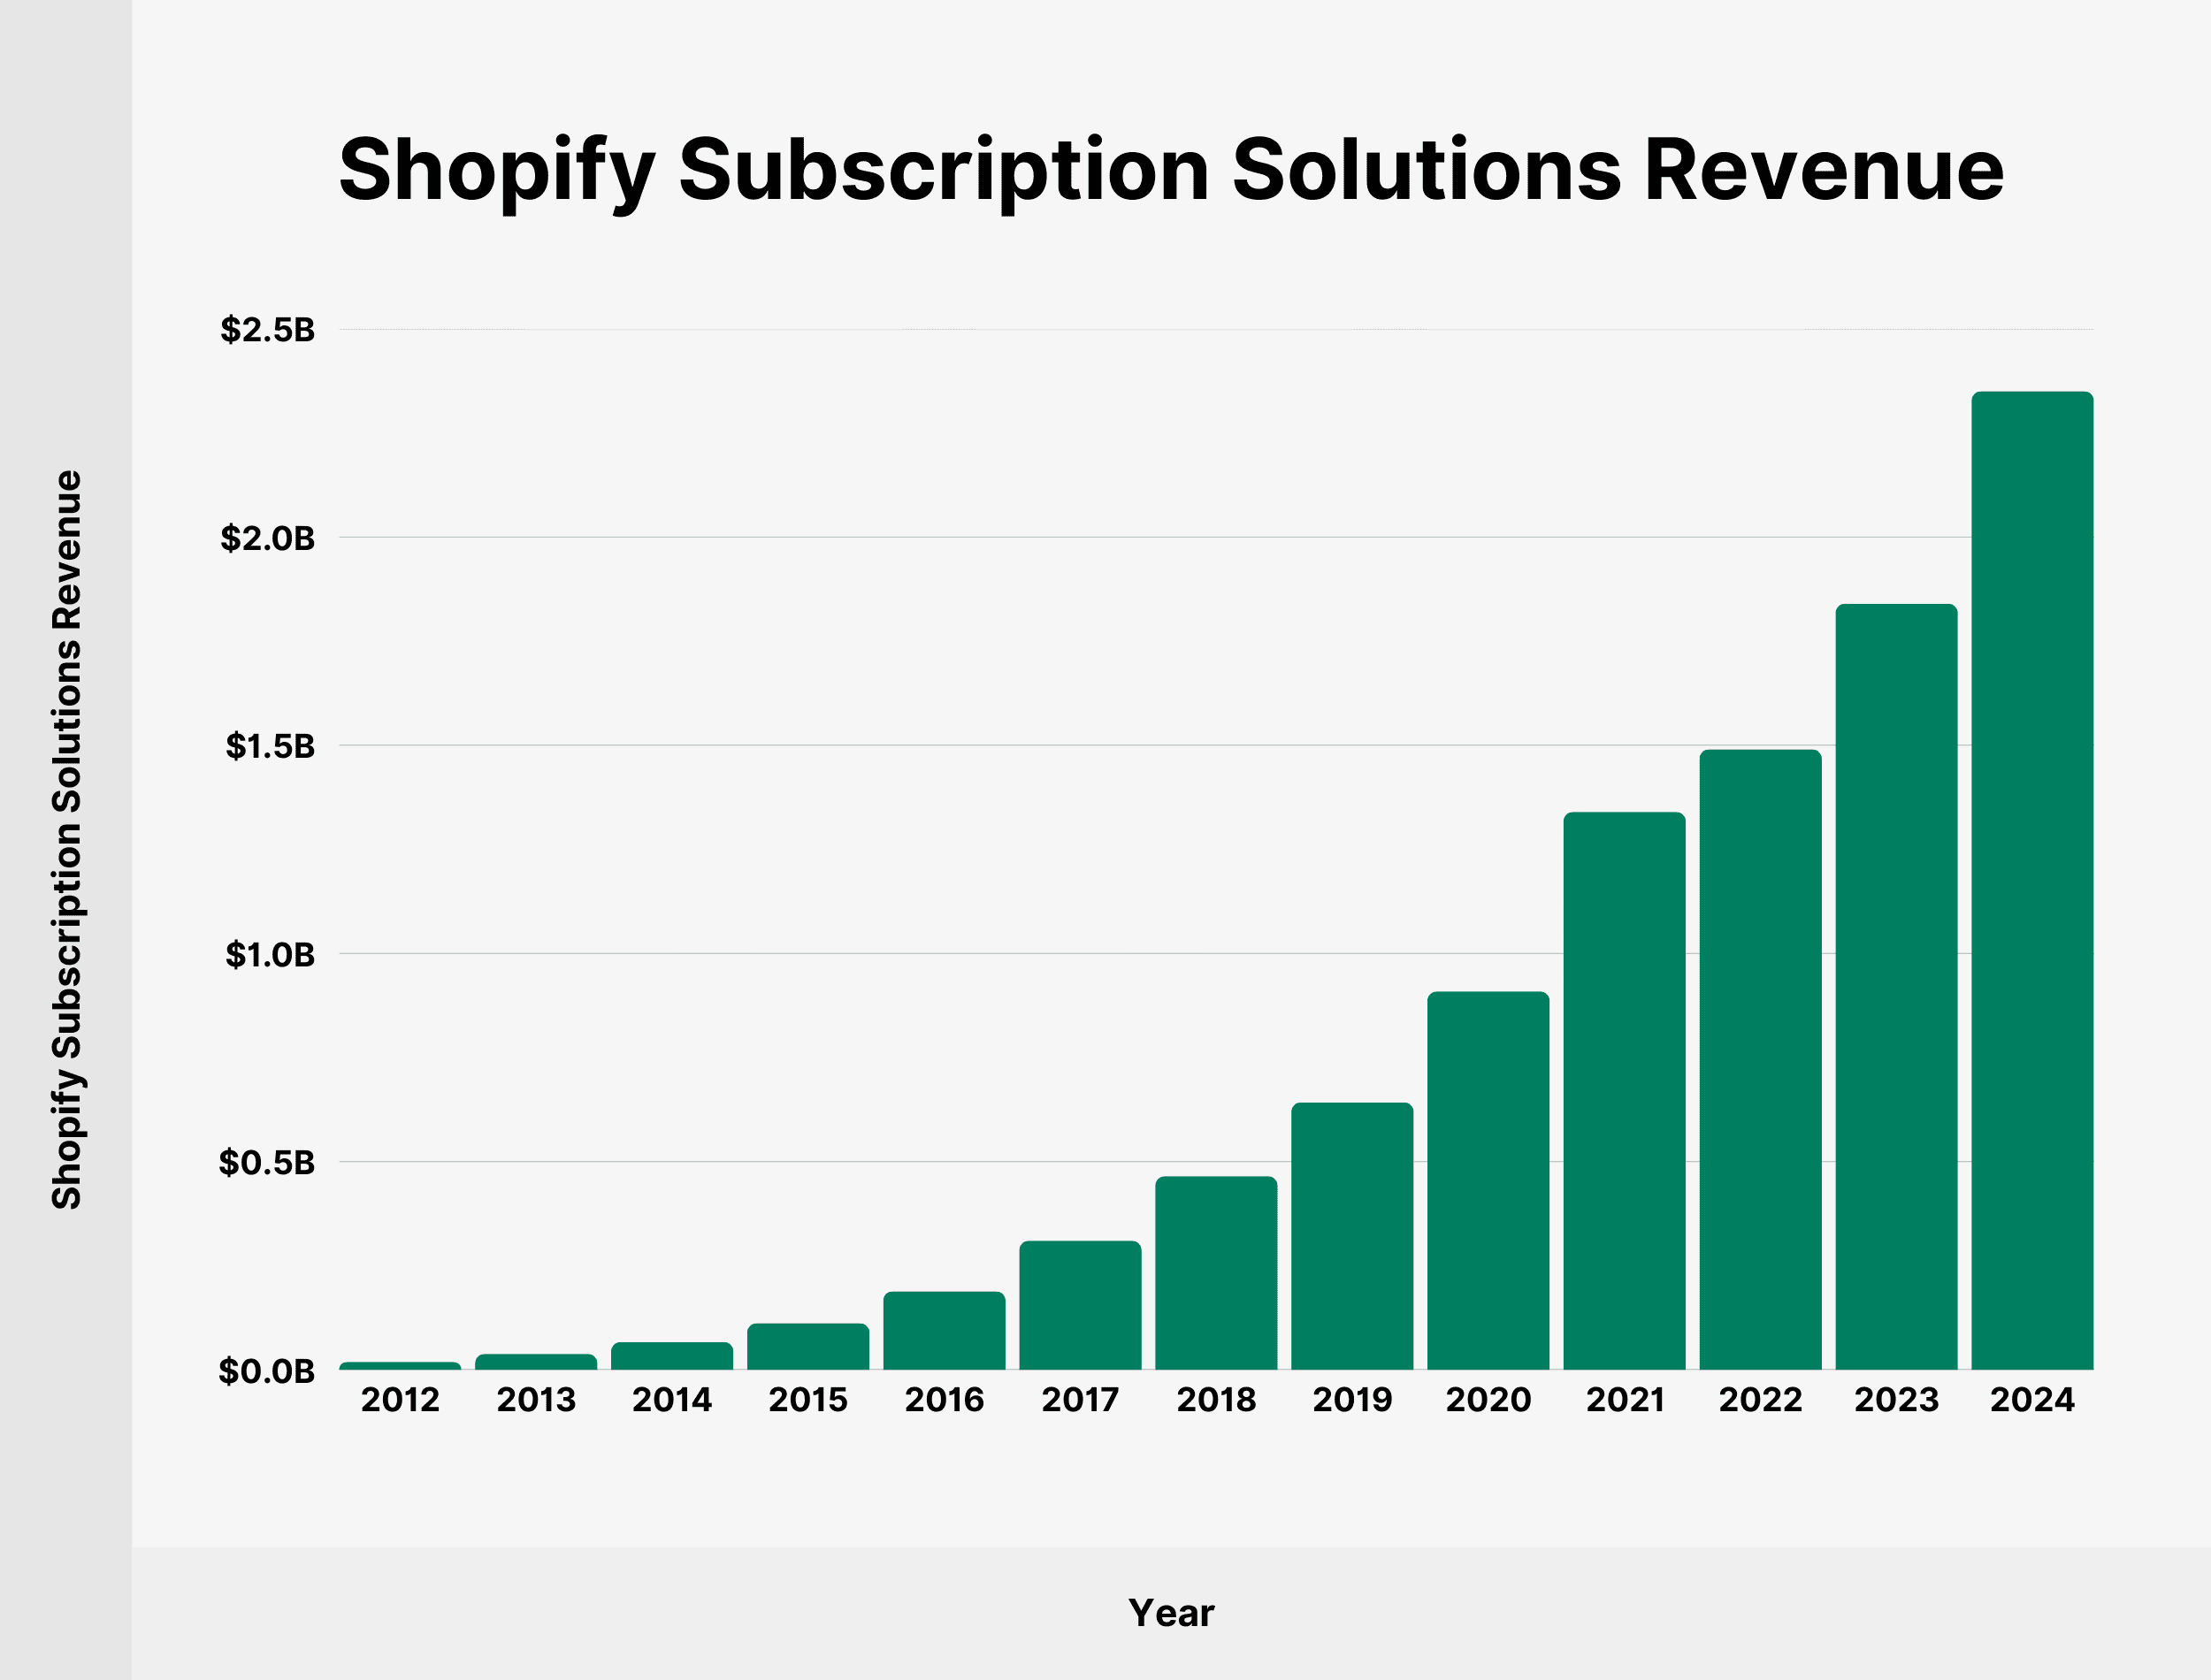
Here’s a table showing Shopify subscription solutions revenues since 2012:
| Year | Shopify Revenue (Share) |
|---|---|
| 2012 | $19.2 million (80.98%) |
| 2013 | $38.34 million (76.3%) |
| 2014 | $66.67 million (63.48%) |
| 2015 | $111.98 million (54.56%) |
| 2016 | $188.61 million (48.44%) |
| 2017 | $310.03 million (46.05%) |
| 2018 | $465 million (43.46%) |
| 2019 | $642.24 million (40.65%) |
| 2020 | $908.76 million (31.01%) |
| 2021 | $1.34 billion (29.07%) |
| 2022 | $1.49 billion (26.6%) |
| 2023 | $1.84 billion (26.06%) |
| 2024 | $2.35 billion (26.7%) |
Source: Shopify
Shopify Merchant Solutions Revenue
Shopify’s merchant solutions revenue primarily consists of payment processing fees. Other revenue sources in this segment include referral fees, advertising revenue, and sales of POS hardware.
Shopify generated $6.53 billion in merchant solutions revenue in 2024, representing 73.54% of total revenue. Merchant solutions have been Shopify’s main revenue source since 2016.
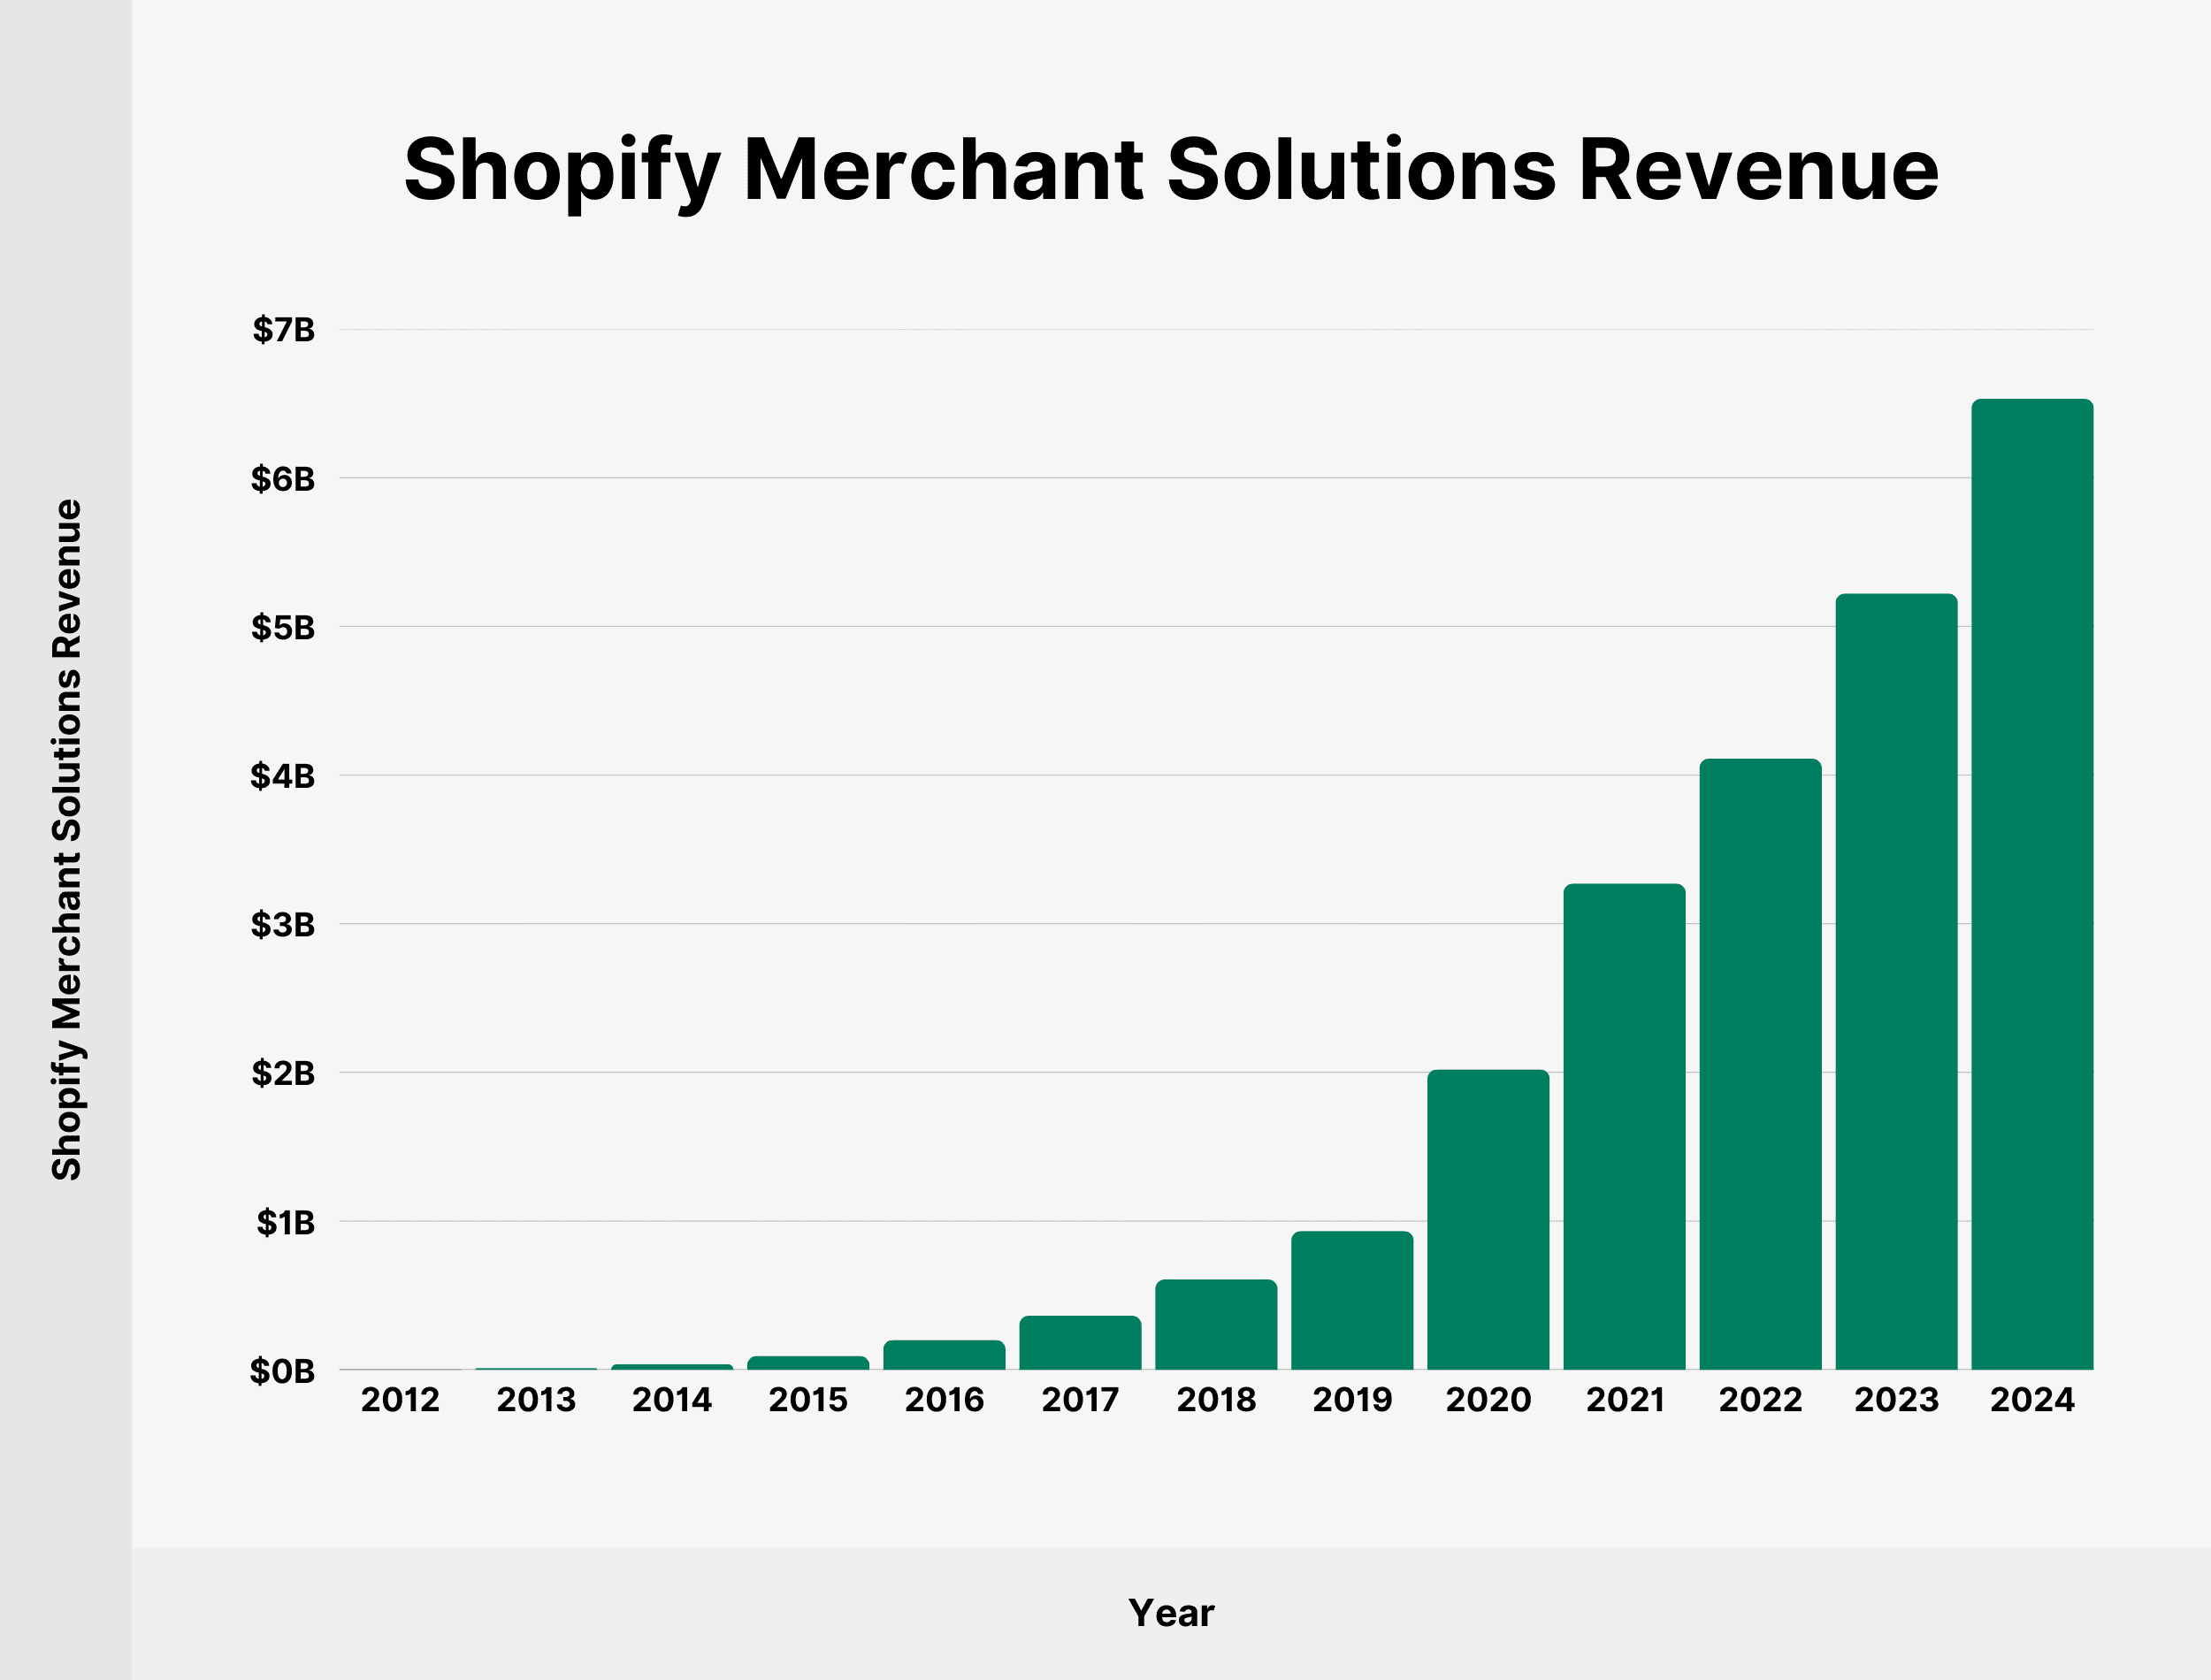
We’ve charted Shopify’s merchant solutions revenues since 2012:
| Year | Shopify Revenue (Share) |
|---|---|
| 2012 | $4.51 million (19.02%) |
| 2013 | $11.91 million (23.7%) |
| 2014 | $38.35 million (36.52%) |
| 2015 | $93.25 million (45.44%) |
| 2016 | $200.72 million (51.56%) |
| 2017 | $363.27 million (53.95%) |
| 2018 | $608.23 million (56.54%) |
| 2019 | $933.93 million (59.35%) |
| 2020 | $2.02 billion (68.99%) |
| 2021 | $3.27 billion (70.93%) |
| 2022 | $4.11 billion (73.39%) |
| 2023 | $5.22 billion (73.94%) |
| 2024 | $6.53 billion (73.54%) |
Source: Shopify
Shopify Revenue by Region
Shopify provides a regional breakdown of revenue, calculated by reference to seller location.
Shopify generated $6.19 billion from sellers located in North America in 2024, totaling 69.71% of overall revenue. All markets outside of North America generated a combined $2.69 billion in 2024.
Here’s Shopify’s regional revenue breakdown in 2024:
| Region | Shopify Revenue |
|---|---|
| North America | $6.19 billion |
| Europe, the Middle East, and Africa | $1.71 billion |
| Asia Pacific, Australia, and China | $885 million |
| Latin America | $97 million |
Source: Shopify
Shopify Monthly Recurring Revenue
Shopify calculates monthly recurring revenue by multiplying the number of merchants at any given time by the average monthly subscription plan fee. Shopify uses this metric as one of its business performance indicators.
Shopify’s monthly recurring revenue reached $178 million in 2024. That’s up 63.3% since 2022.
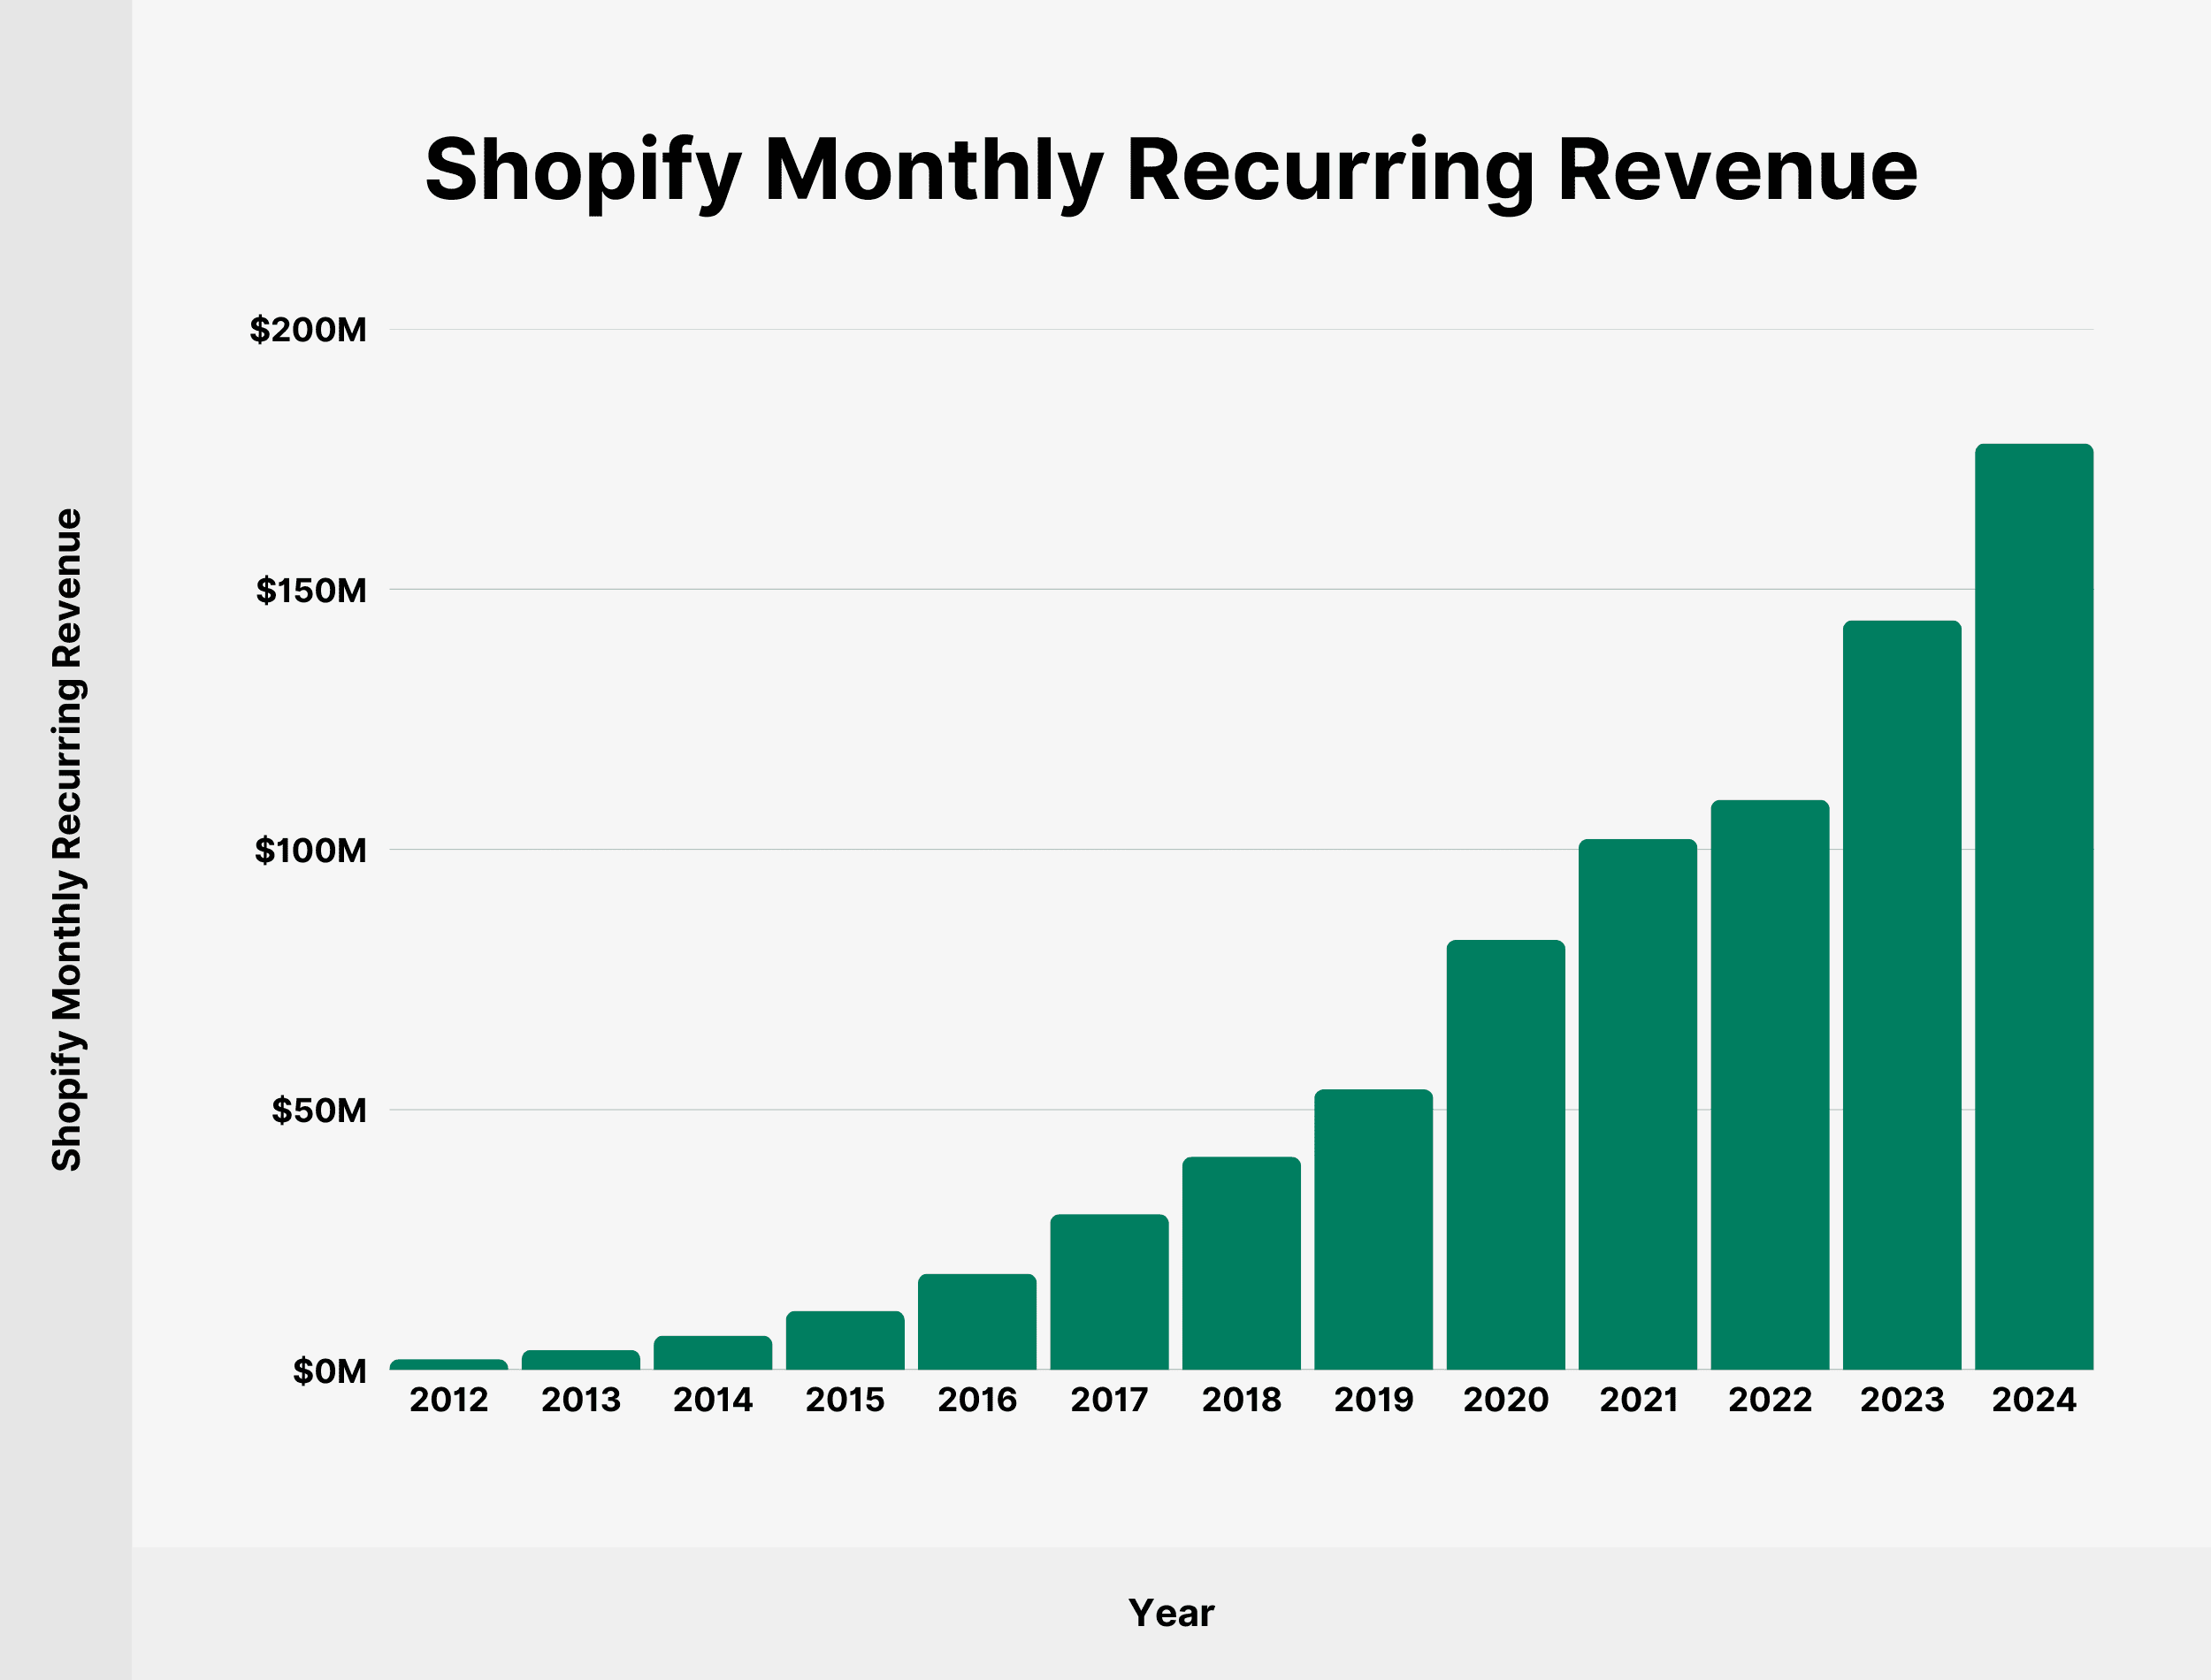
Here’s a table showing Shopify’s monthly recurring revenue since 2012:
| Year | Shopify Monthly Recurring Revenue |
|---|---|
| 2012 | $2.02 million |
| 2013 | $3.82 million |
| 2014 | $6.57 million |
| 2015 | $11.33 million |
| 2016 | $18.46 million |
| 2017 | $29.88 million |
| 2018 | $40.93 million |
| 2019 | $53.9 million |
| 2020 | $82.61 million |
| 2021 | $102.02 million |
| 2022 | $109.51 million |
| 2023 | $144 million |
| 2024 | $178 million |
Source: Shopify
Number of Apps on the Shopify App Store
According to the latest official figures, Shopify has over 13,000 apps available for download in the Shopify App Store.
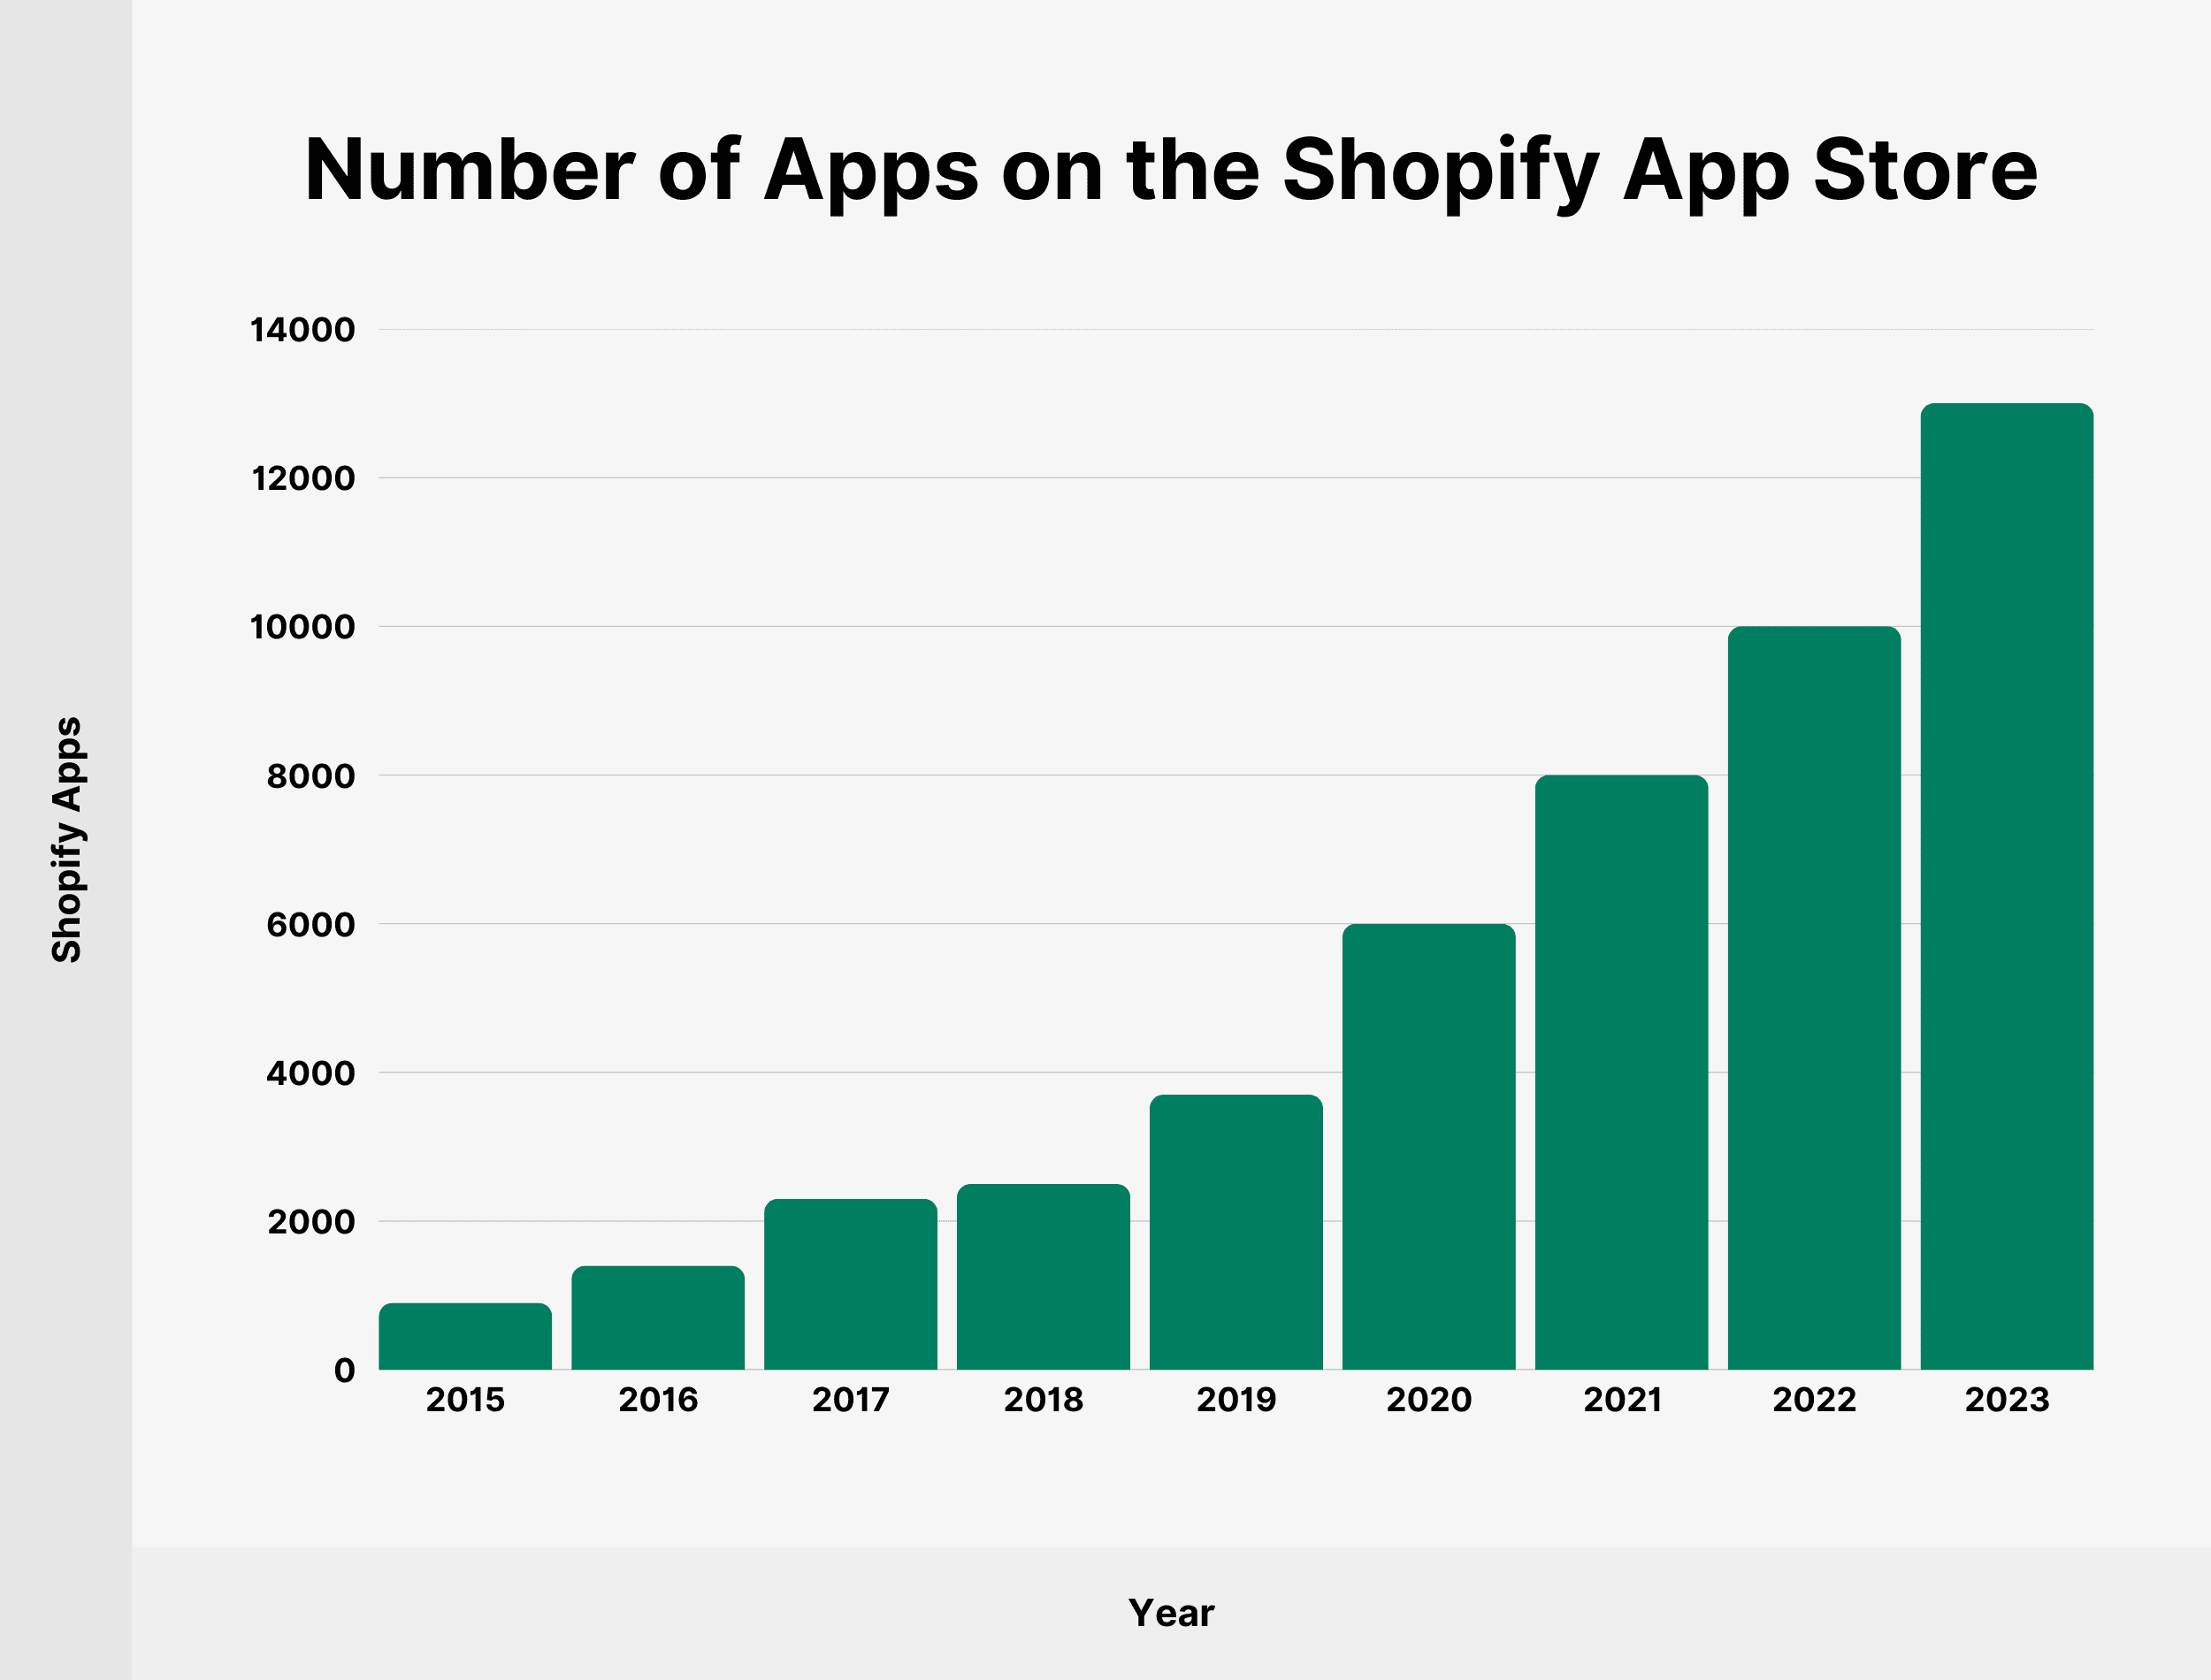
Since 2020, the Shopify app count has increased by 2.17x.
Here’s a table with the number of apps in the Shopify App Store since 2015:
| Year | Shopify Apps |
|---|---|
| 2015 | 900 |
| 2016 | 1,400 |
| 2017 | 2,300 |
| 2018 | 2,500 |
| 2019 | 3,700 |
| 2020 | 6,000 |
| 2021 | 8,000 |
| 2022 | 10,000 |
| 2023 | 13,000 |
Source: Shopify
What’s the Shopify Market Share?
Based on gross merchandise volume in 2023, Shopify stores in the US claimed a 12% market share of all retail ecommerce sales nationwide.
In Western Europe, Shopify claims around 8% market share of ecommerce sales.
Source: Shopify
How Many People Work at Shopify?
Shopify has 8,100 employees and contractors worldwide, according to the latest available figures. The company has decreased its employee count by 30.17% since 2022.
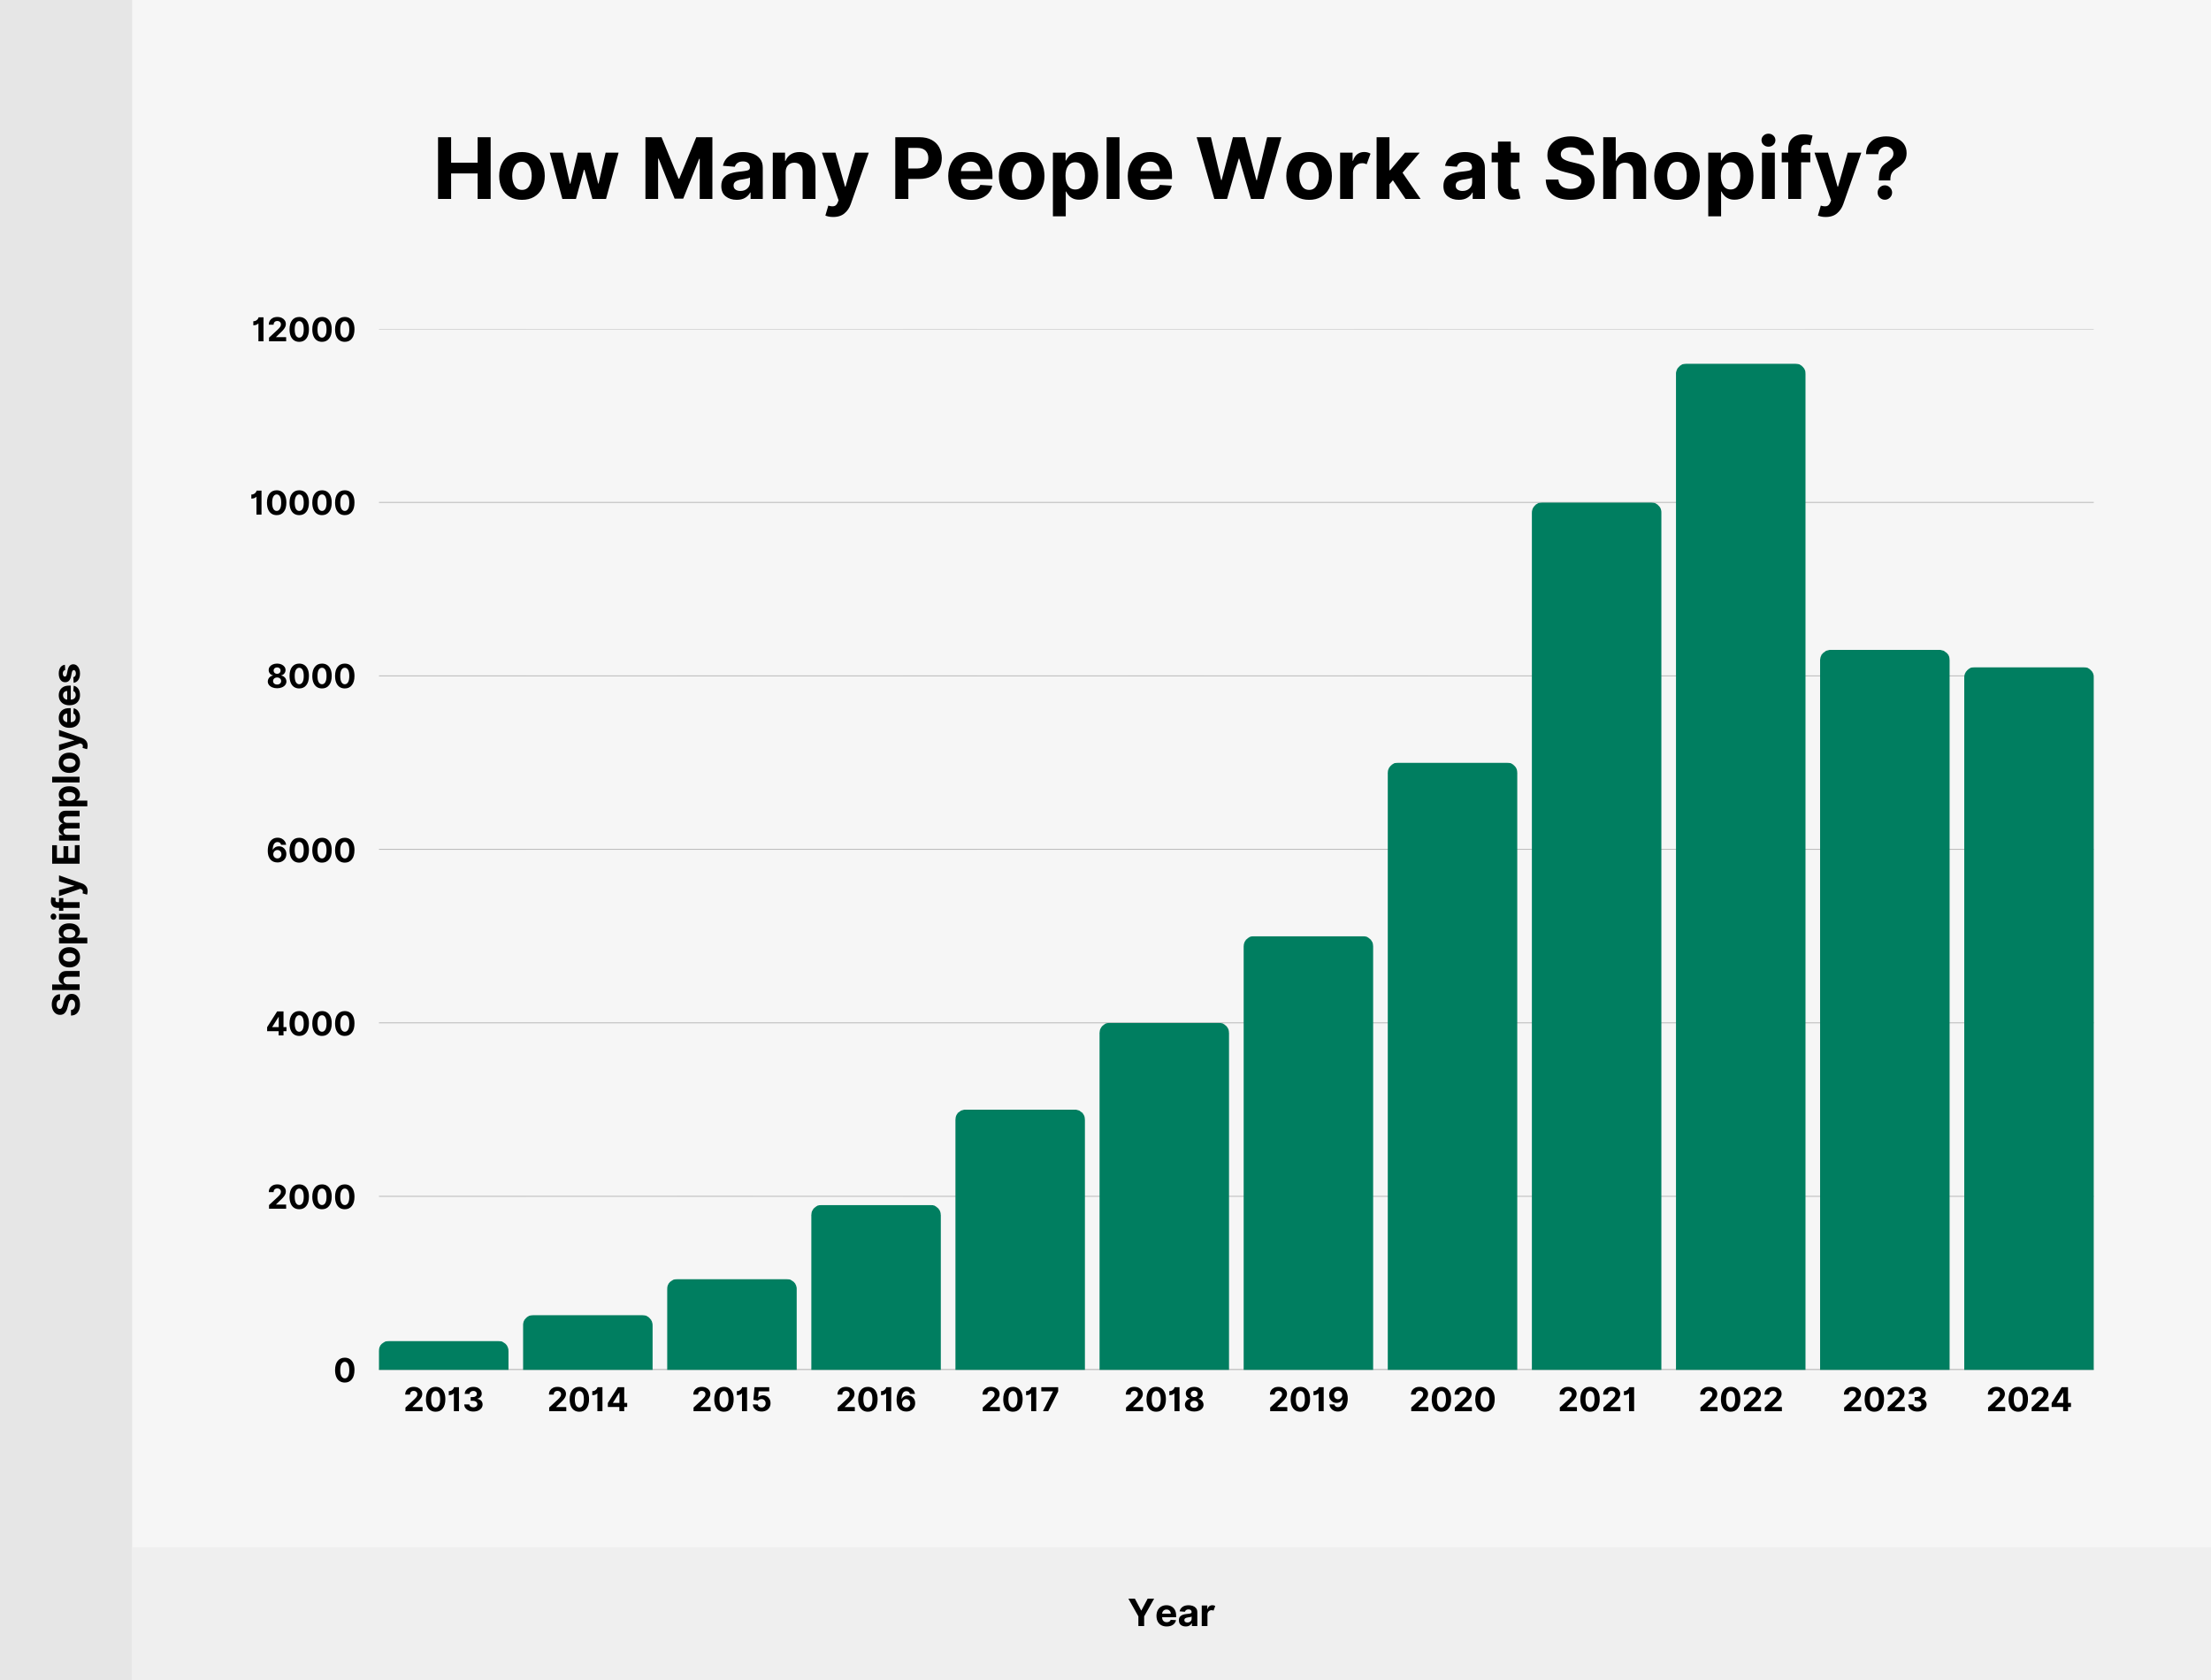
Here’s a table with the number of employees and contractors at Shopify since 2013:
| Year | Shopify Employees |
|---|---|
| 2013 | 334 |
| 2014 | 632 |
| 2015 | 1,048 |
| 2016 | 1,900 |
| 2017 | 3,000 |
| 2018 | 4,000 |
| 2019 | 5,000 |
| 2020 | 7,000 |
| 2021 | 10,000 |
| 2022 | 11,600 |
| 2023 | 8,300 |
| 2024 | 8,100 |
Source: Shopify
Conclusion
That’s all for my list of Shopify stats in 2026.
The ecommerce platform is growing rapidly. Merchants, buyers, and gross merchandise volume are all increasing year over year.
As more businesses adopt ecommerce channels, Shopify’s online sales portal presents an attractive package.
If you have a Shopify store that could benefit from improved performance, consider utilizing the Ecommerce Booster app. It audits the main areas of page performance: visual and text content, user experience, page speed, and accessibility on your site. You’ll get a ready-to-implement action plan and built-in AI tools to simplify store optimization.
Backlinko is owned by Semrush. We’re still obsessed with bringing you world-class SEO insights, backed by hands-on experience. Unless otherwise noted, this content was written by either an employee or paid contractor of Semrush Inc.
