Coinbase is a leading cryptocurrency exchange.
Launched in 2012, the platform registered its first million users in less than 2 years.
Today, Coinbase has 8.7 million monthly transacting users and processes a trading volume of $425 billion per quarter.
Continue reading to find the latest statistics on Coinbase in 2026.
Here’s a quick overview of what you’ll find on this page:
- Key Coinbase Stats
- Coinbase Monthly Transacting Users
- How Many Users Does Coinbase Have?
- Coinbase One Subscribers
- Assets on the Coinbase platform
- What Are the Most Held Currencies on Coinbase?
- Coinbase Retail Trading Volume
- Coinbase Institutional Trading Volume
- What Are the Most Traded Currencies on Coinbase?
- How Many Cryptocurrency Assets Are Supported on Coinbase?
- Coinbase Total Revenue
- Coinbase Transaction Revenue
- Coinbase Subscription and Services Revenue
- How Many People Work at Coinbase?
Key Coinbase Stats
- Coinbase has 8.7 million monthly transacting users.
- Coinbase generated approximately $6.6 billion in 2024. And has already made $2 billion in the first 3 months of 2025 alone.
- Trading volume on Coinbase in Q2 2025 was $425 billion.
- 3,772 employees work at Coinbase.
Coinbase Monthly Transacting Users
Coinbase defines monthly transacting users as all users with at least one transaction on the platform during a 28-day period.
As of Q2 2025, Coinbase has 8.7 million monthly transacting users. That’s down from 8.2 million transacting users in Q2 2024.
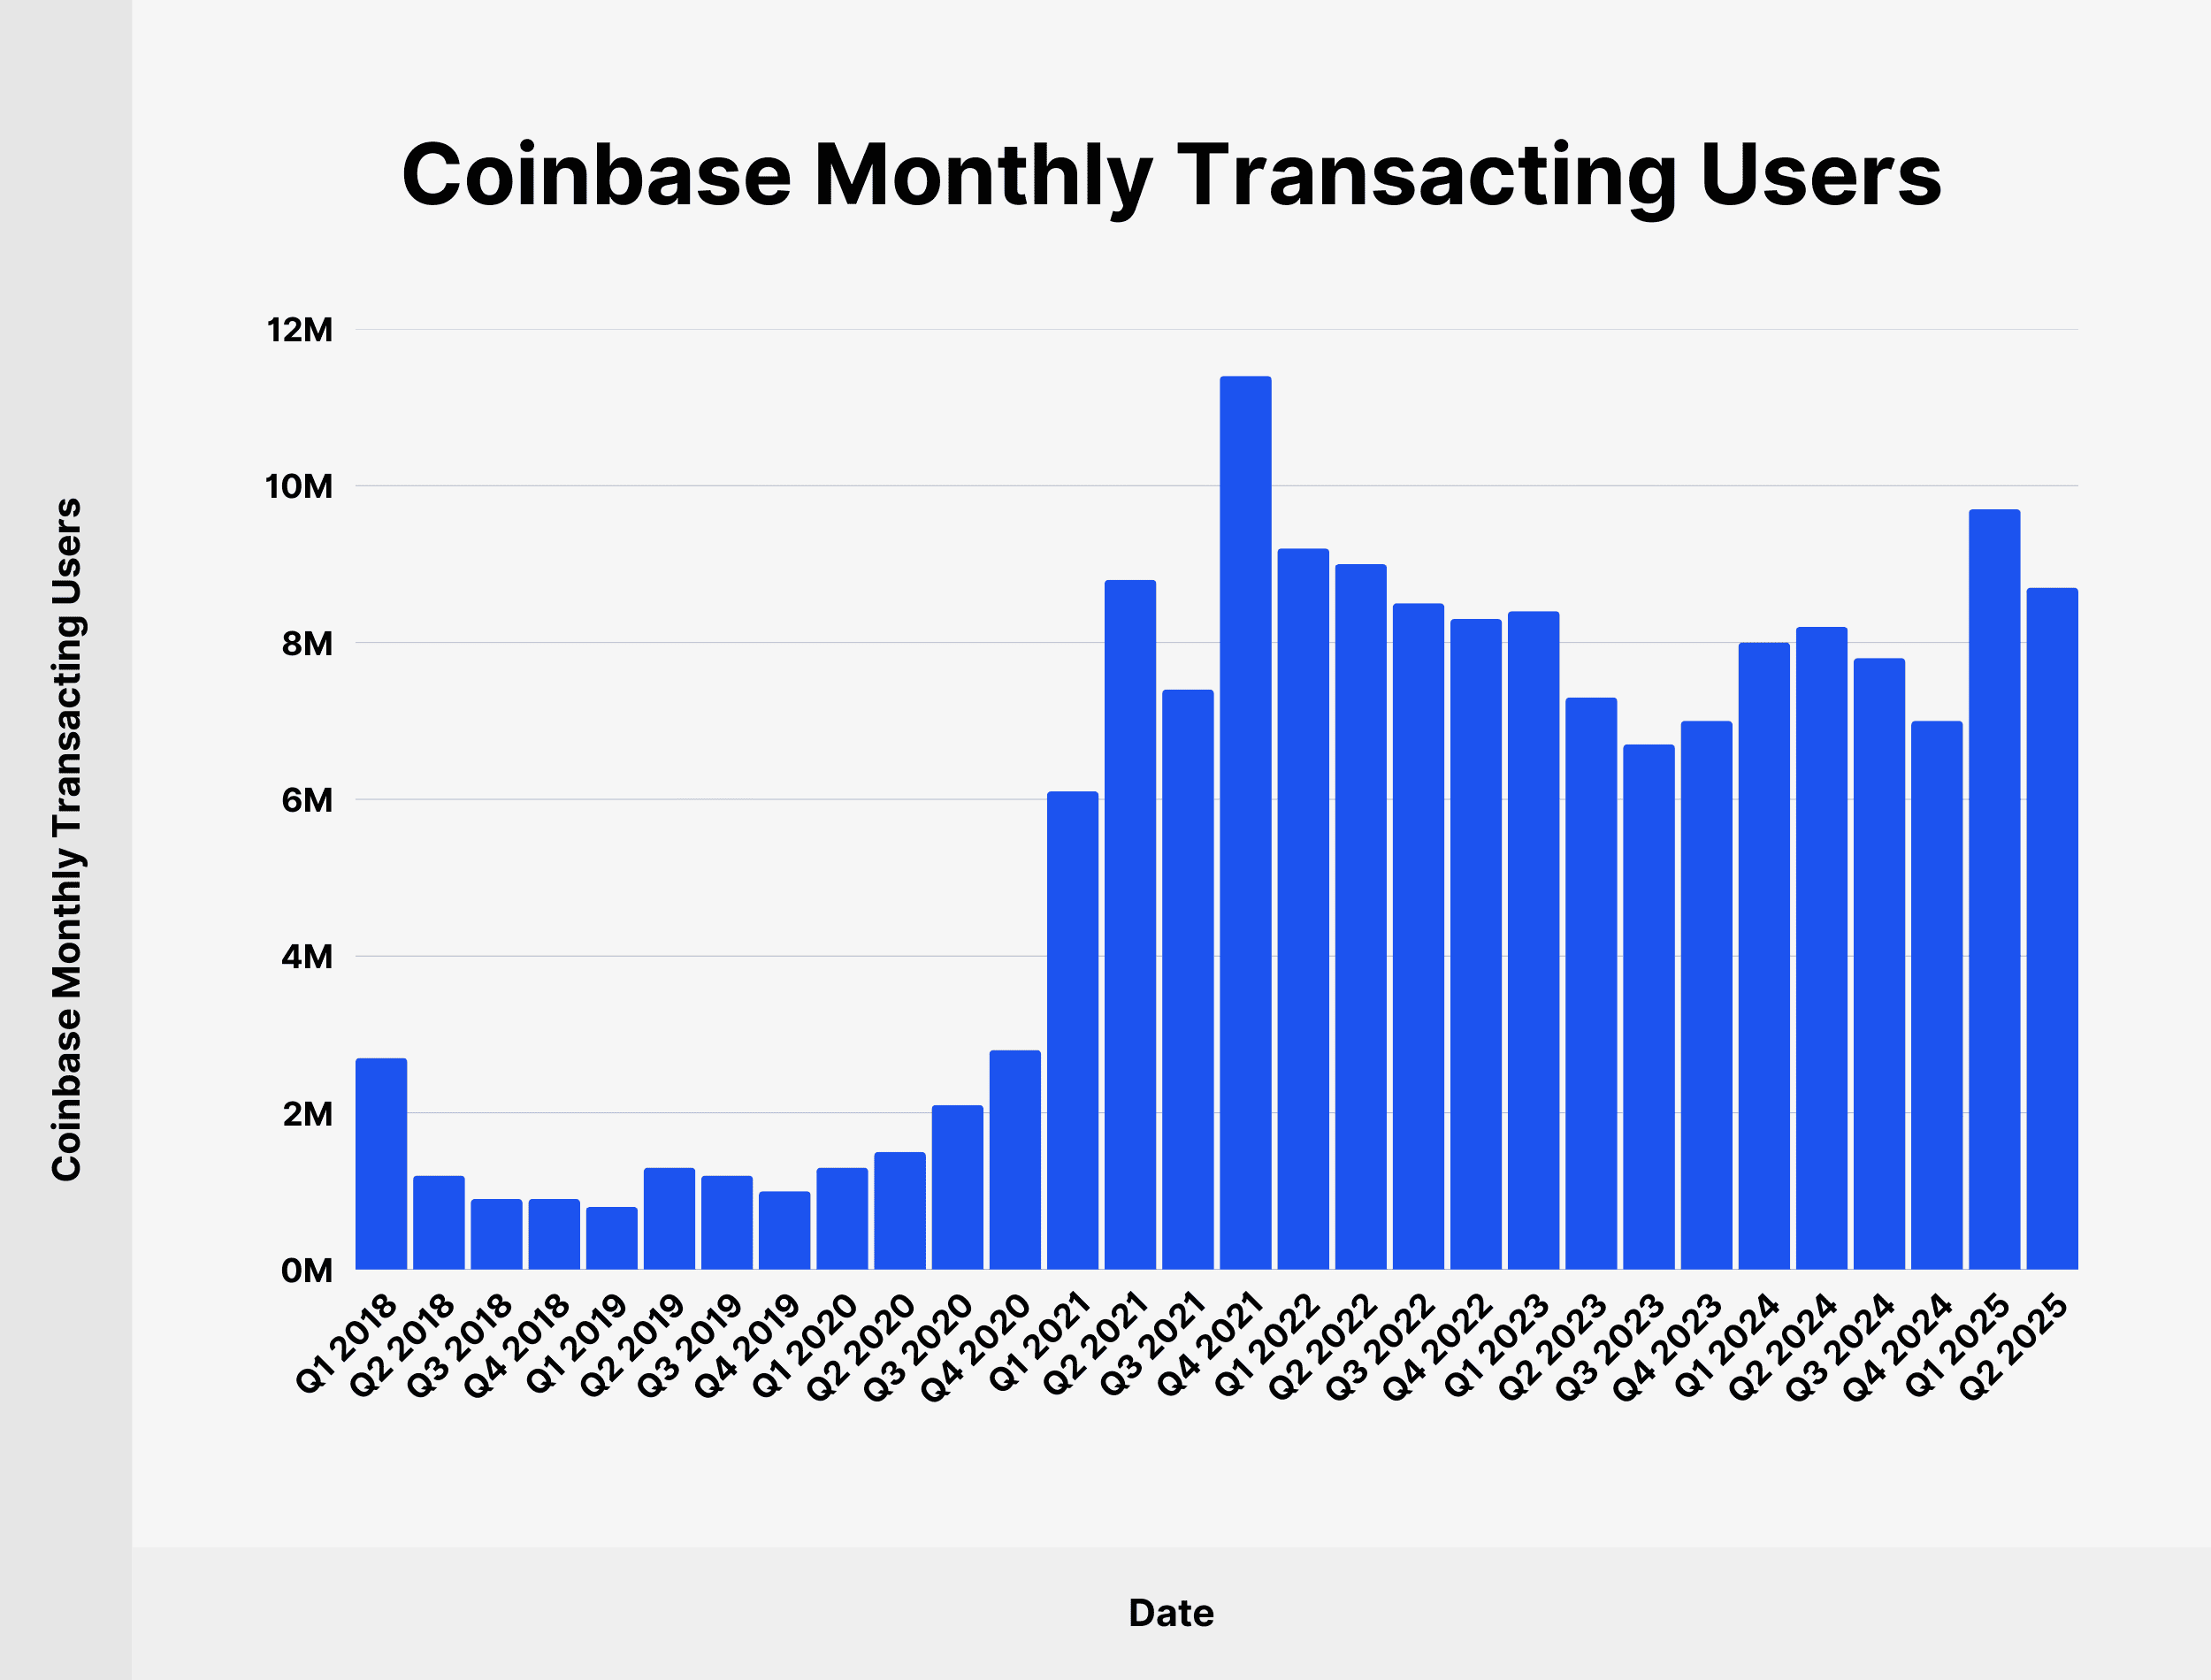
Here’s the full breakdown of Coinbase’s monthly transacting users since Q1 2018:
| Date | Coinbase Monthly Transacting Users |
|---|---|
| Q1 2018 | 2.7 million |
| Q2 2018 | 1.2 million |
| Q3 2018 | 0.9 million |
| Q4 2018 | 0.9 million |
| Q1 2019 | 0.8 million |
| Q2 2019 | 1.3 million |
| Q3 2019 | 1.2 million |
| Q4 2019 | 1 million |
| Q1 2020 | 1.3 million |
| Q2 2020 | 1.5 million |
| Q3 2020 | 2.1 million |
| Q4 2020 | 2.8 million |
| Q1 2021 | 6.1 million |
| Q2 2021 | 8.8 million |
| Q3 2021 | 7.4 million |
| Q4 2021 | 11.4 million |
| Q1 2022 | 9.2 million |
| Q2 2022 | 9 million |
| Q3 2022 | 8.5 million |
| Q4 2022 | 8.3 million |
| Q1 2023 | 8.4 million |
| Q2 2023 | 7.3 million |
| Q3 2023 | 6.7 million |
| Q4 2023 | 7 million |
| Q1 2024 | 8 million |
| Q2 2024 | 8.2 million |
| Q3 2024 | 7.8 million |
| Q4 2024 | 7 million |
| Q1 2025 | 9.7 million |
| Q2 2025 | 8.7 million |
Source: Coinbase
How Many Users Does Coinbase Have?
Until Q4 2022, Coinbase disclosed the number of verified users (all users with a registered account and a confirmed email address or phone number).
Coinbase had 110 million verified users in Q4 2022. The platform added 21 million new verified users between Q4 2021 and Q4 2022.
As of 2025, it is estimated that Coinbase has approximately 120 million verified users.
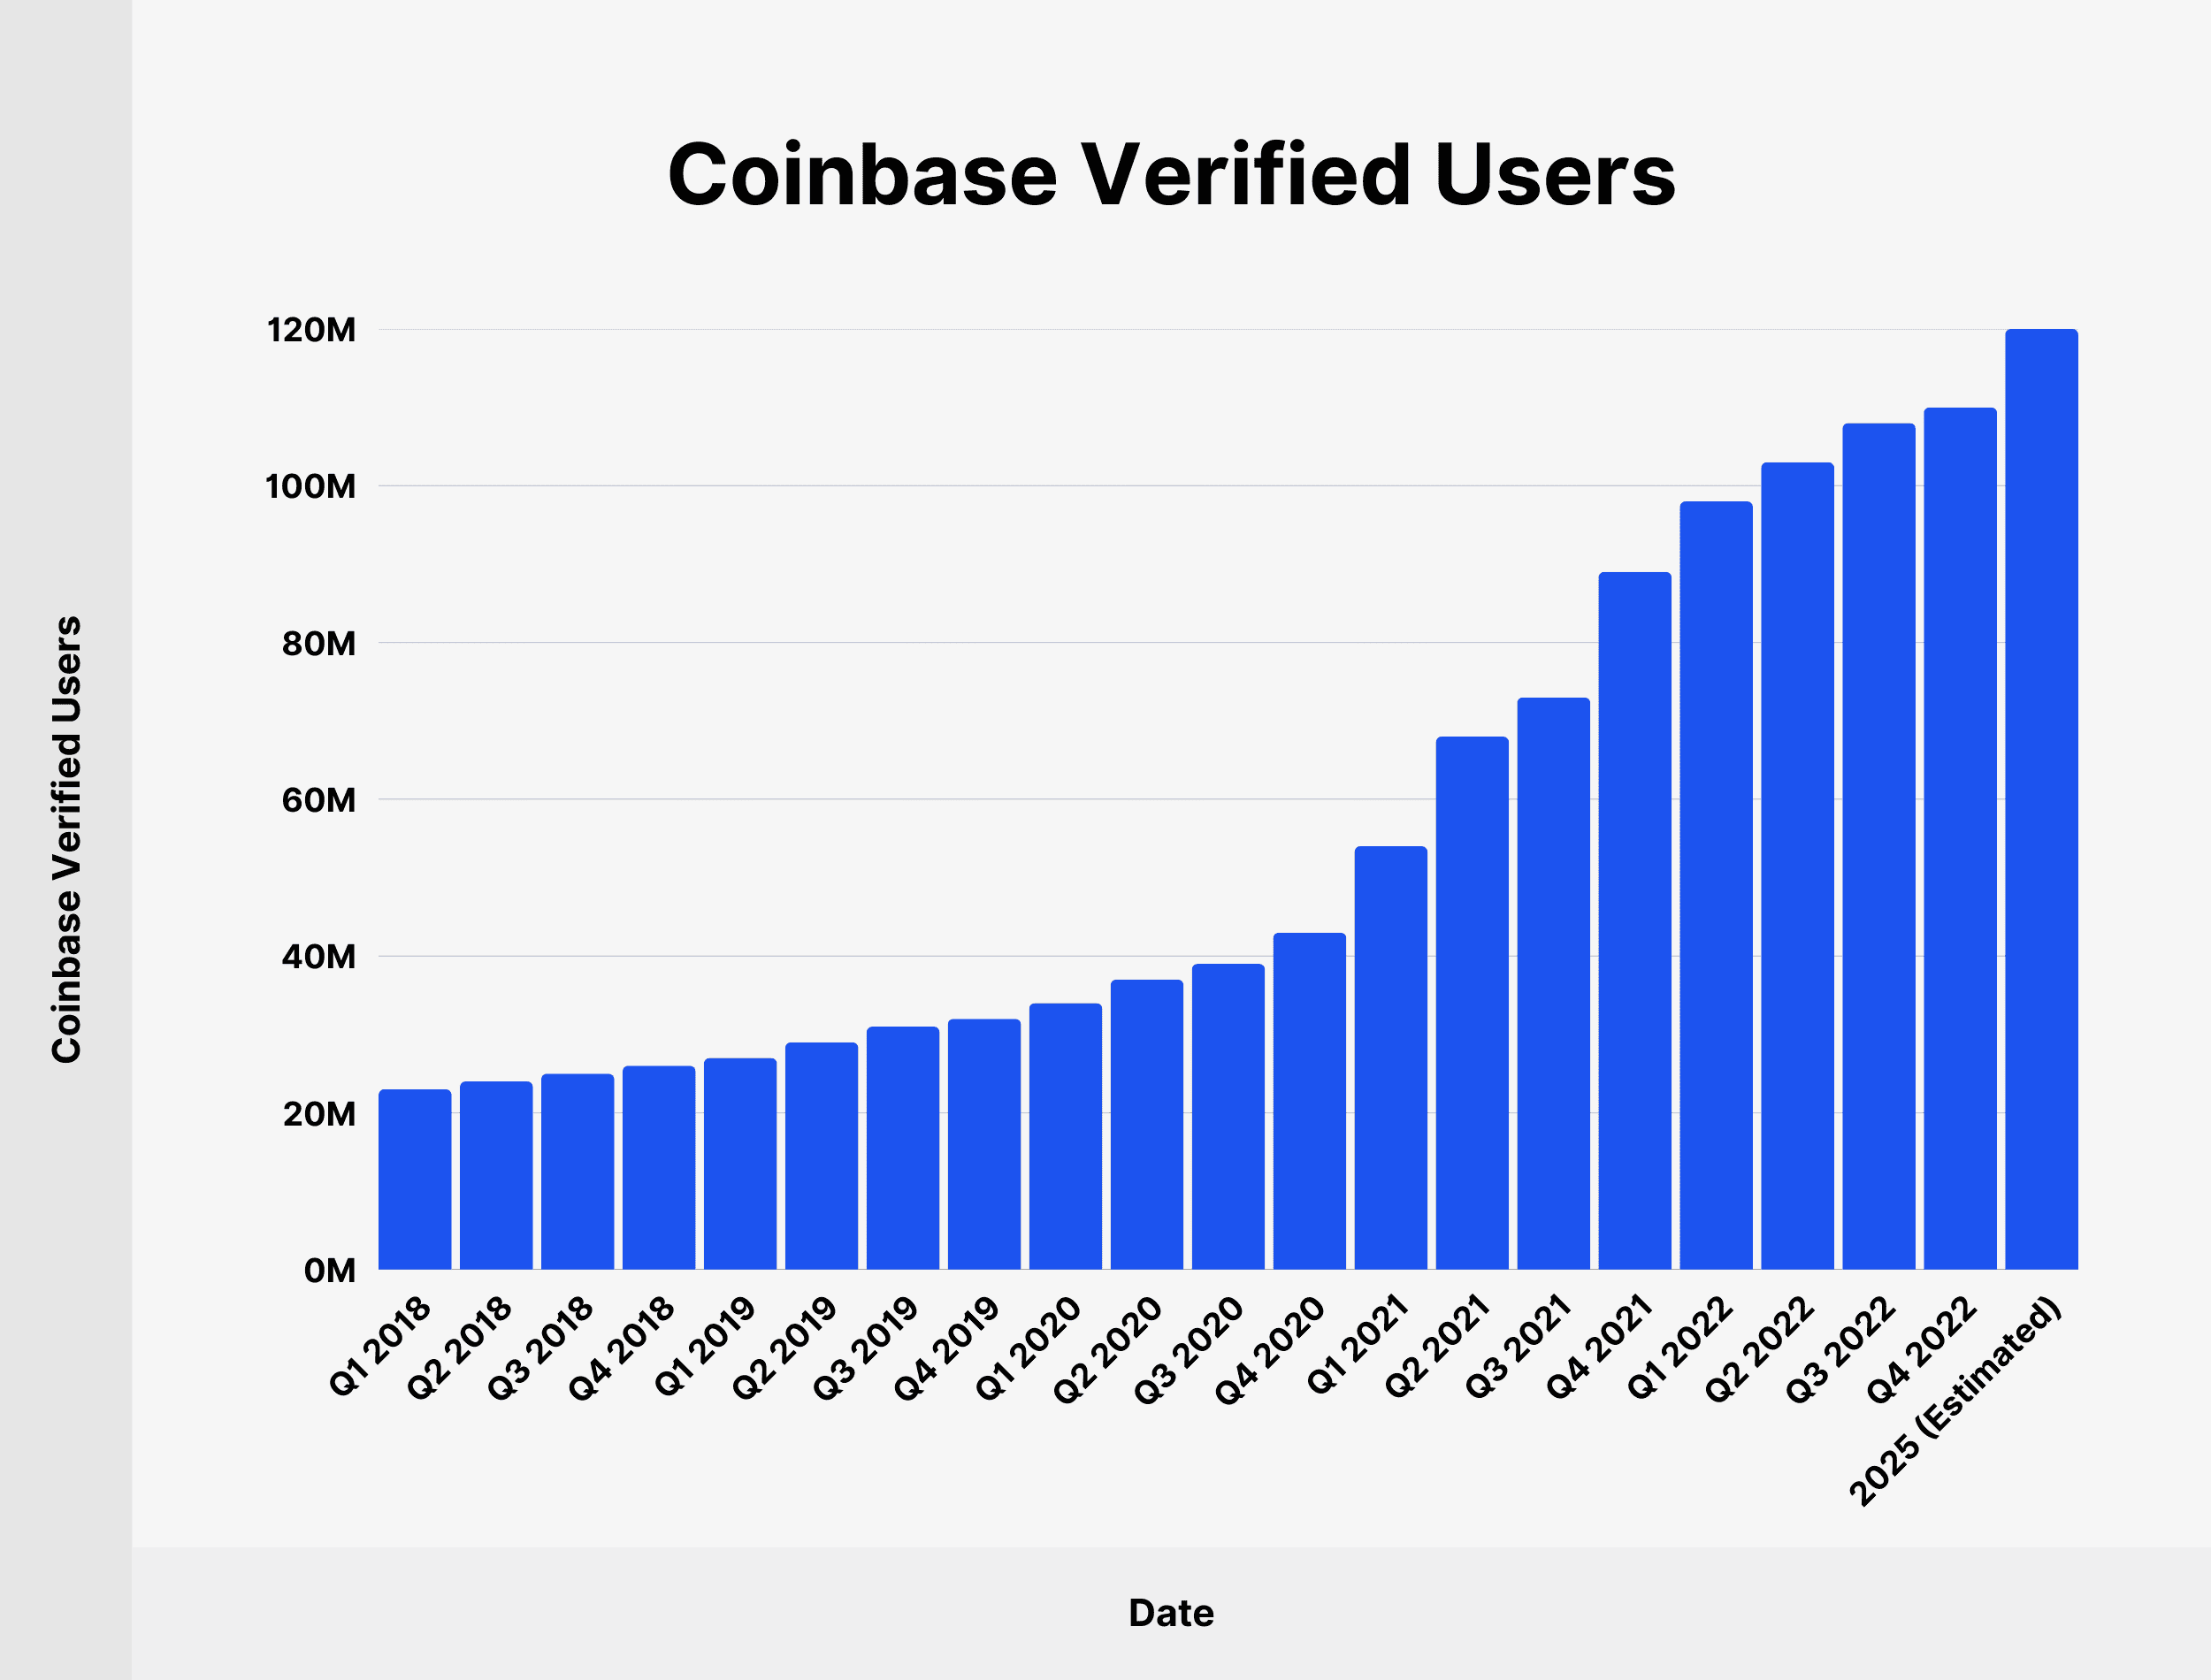
Here’s the full breakdown of Coinbase user growth since Q1 2018:
| Date | Coinbase Verified Users |
|---|---|
| Q1 2018 | 23 million |
| Q2 2018 | 24 million |
| Q3 2018 | 25 million |
| Q4 2018 | 26 million |
| Q1 2019 | 27 million |
| Q2 2019 | 29 million |
| Q3 2019 | 31 million |
| Q4 2019 | 32 million |
| Q1 2020 | 34 million |
| Q2 2020 | 37 million |
| Q3 2020 | 39 million |
| Q4 2020 | 43 million |
| Q1 2021 | 54 million |
| Q2 2021 | 68 million |
| Q3 2021 | 73 million |
| Q4 2021 | 89 million |
| Q1 2022 | 98 million |
| Q2 2022 | 103 million |
| Q3 2022 | 108 million |
| Q4 2022 | 110 million |
| 2025 (Estimated) | 120 million |
Coinbase One Subscribers
Coinbase offers a paid subscription (Coinbase One) for $29.99 per month, which includes zero trading fees under a certain limit, priority support, and other exclusive benefits.
As of Q4 2024, Coinbase has over 600,000 paid subscribers, which accounts for around 7% of the monthly transacting user base.

Source: Coinbase
Assets on the Coinbase Platform
As of June 2025, Coinbase customers held $425 billion worth of assets on the platform. That’s a 27% increase since Q1 2024.
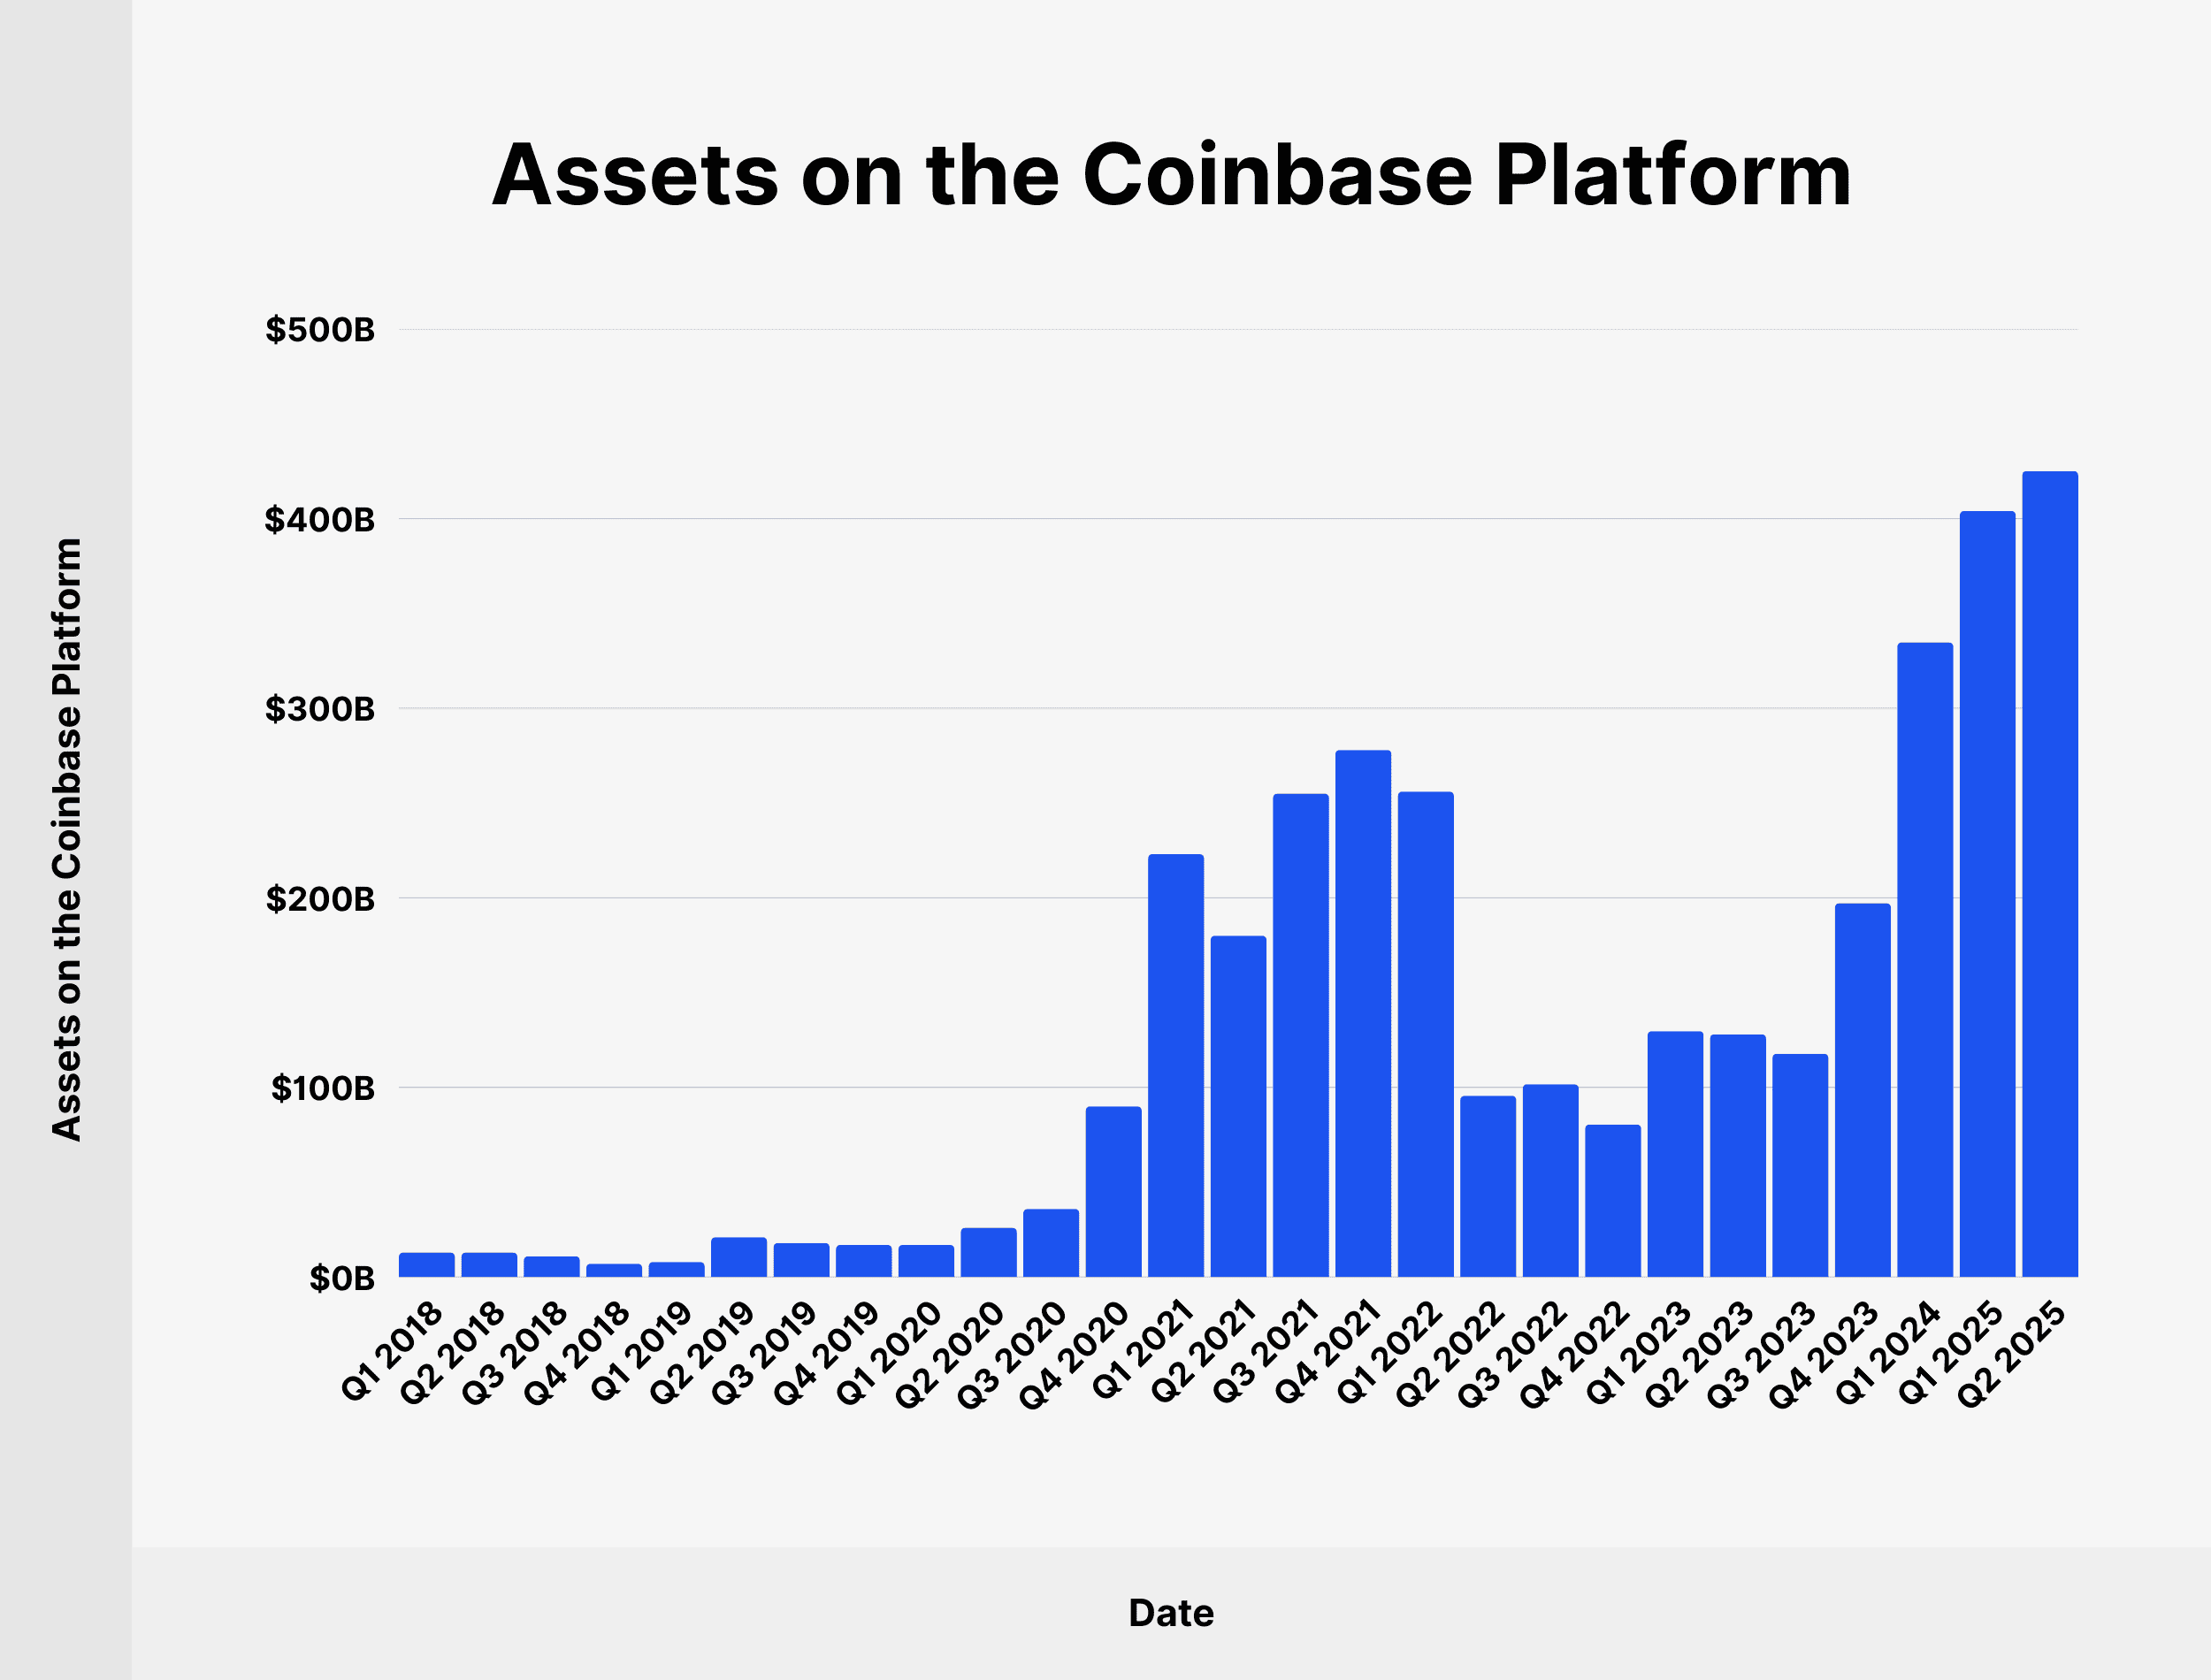
Here’s a comprehensive overview of the value of assets on the Coinbase platform since Q1 2018:
| Date | Assets on the Coinbase Platform |
|---|---|
| Q1 2018 | $13 billion |
| Q2 2018 | $13 billion |
| Q3 2018 | $11 billion |
| Q4 2018 | $7 billion |
| Q1 2019 | $8 billion |
| Q2 2019 | $21 billion |
| Q3 2019 | $18 billion |
| Q4 2019 | $17 billion |
| Q1 2020 | $17 billion |
| Q2 2020 | $26 billion |
| Q3 2020 | $36 billion |
| Q4 2020 | $90 billion |
| Q1 2021 | $223 billion |
| Q2 2021 | $180 billion |
| Q3 2021 | $255 billion |
| Q4 2021 | $278 billion |
| Q1 2022 | $256 billion |
| Q2 2022 | $95.64 billion |
| Q3 2022 | $101.7 billion |
| Q4 2022 | $80.45 billion |
| Q1 2023 | $129.73 billion |
| Q2 2023 | $128.09 billion |
| Q3 2023 | $117.78 billion |
| Q4 2023 | $197.15 billion |
| Q1 2024 | $334.71 billion |
| Q1 2025 | $404 billion |
| Q2 2025 | $425 billion |
What Are the Most Held Currencies on Coinbase?
Bitcoin and Ethereum represent 46% of all crypto assets on the Coinbase platform.
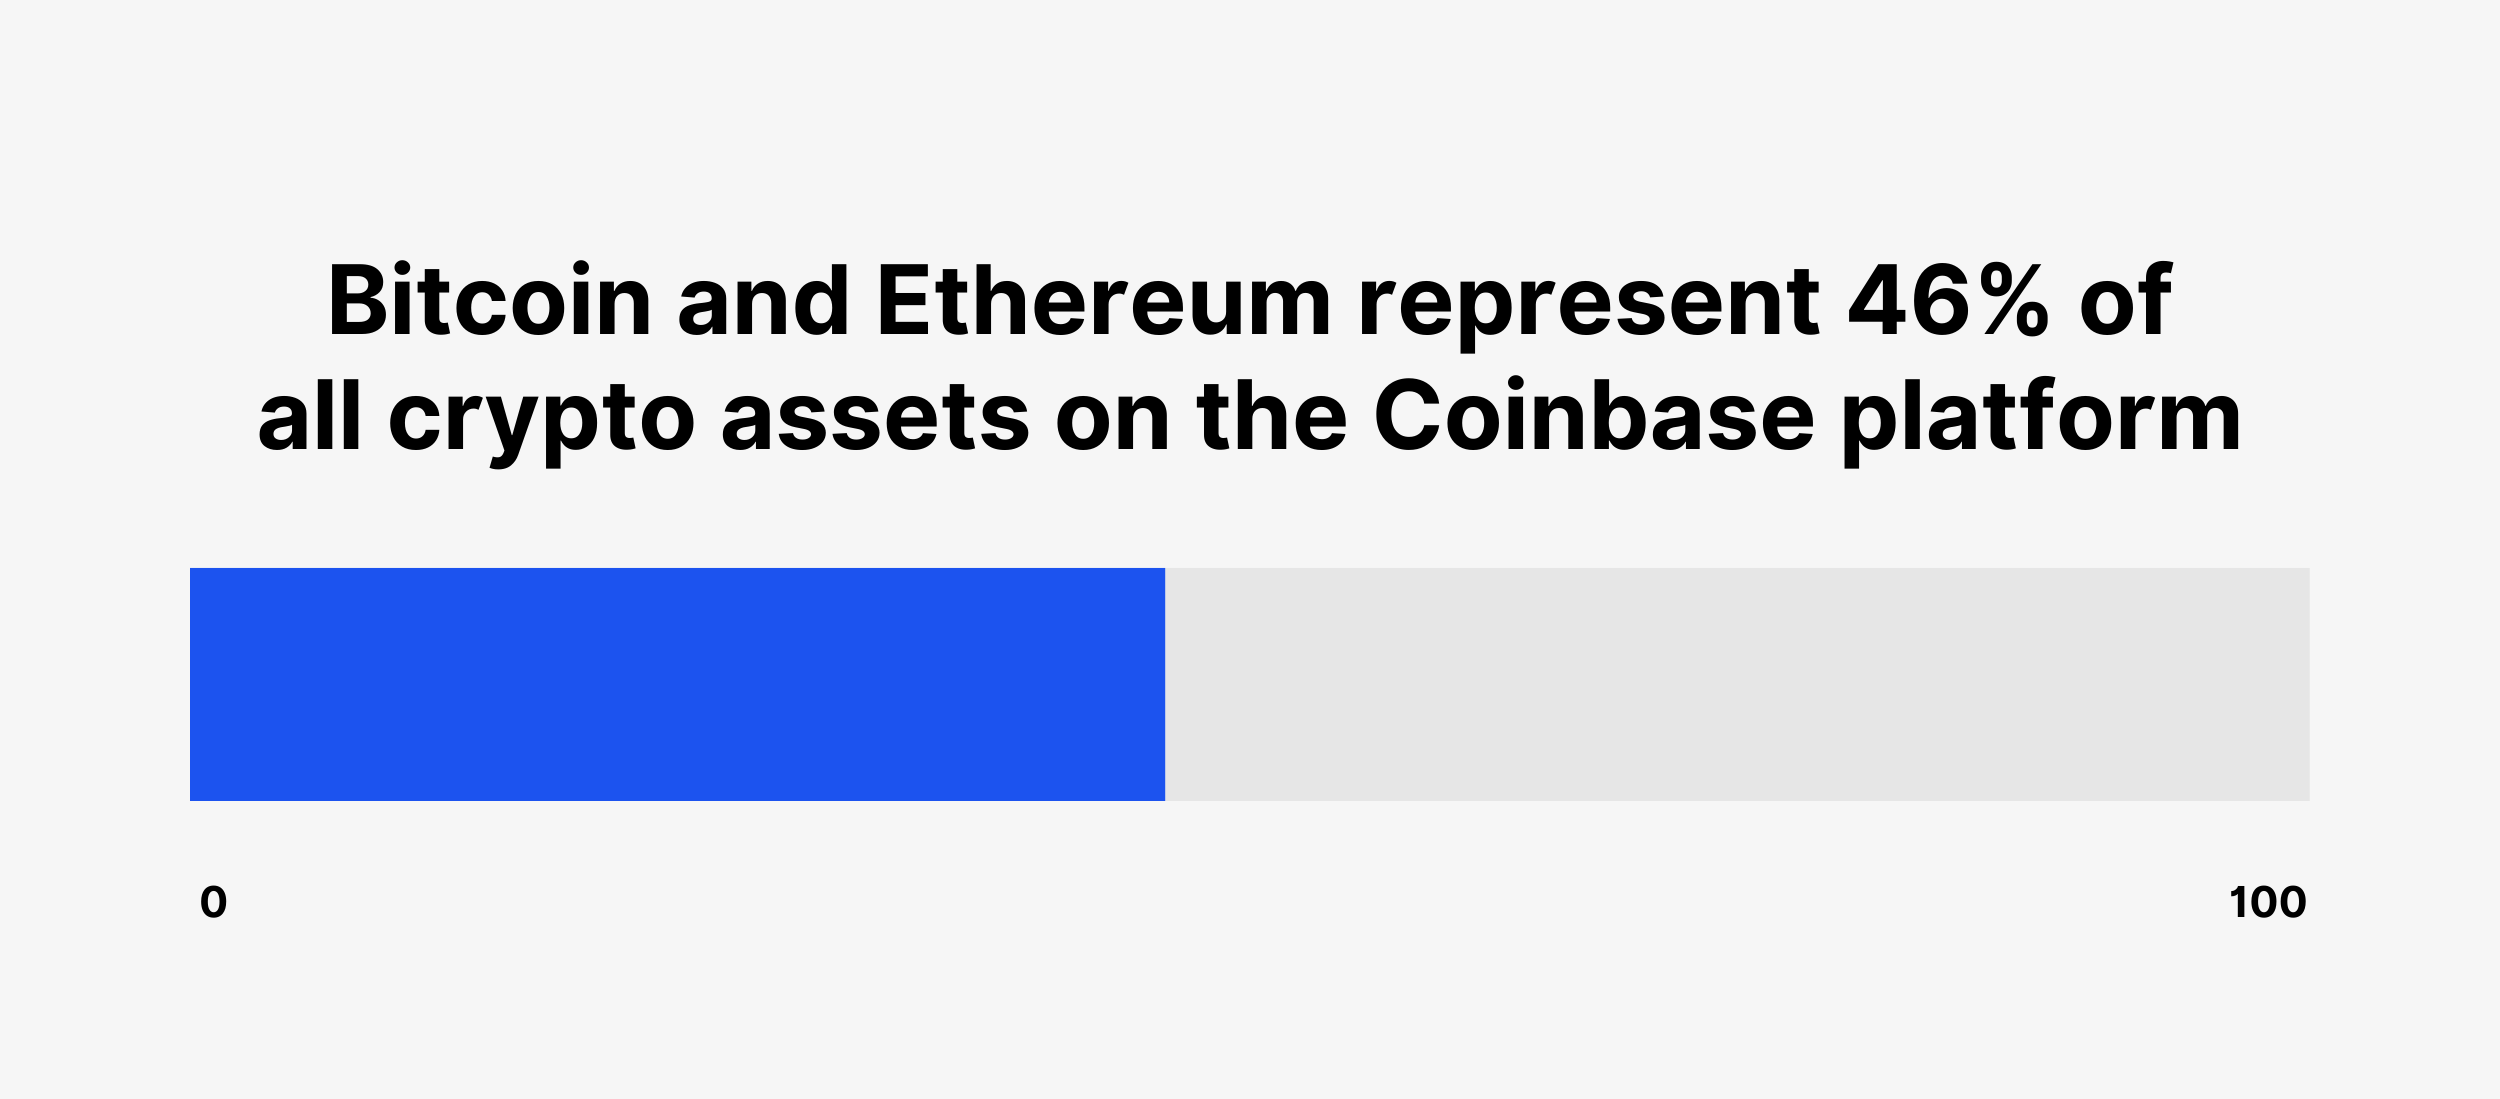
Other supported crypto assets account for a 54% share.
Here’s a complete breakdown of crypto assets held on Coinbase:
| Asset | Share of Total |
|---|---|
| Bitcoin | 34% |
| XRP | 13% |
| Ethereum | 12% |
| Solana | 11% |
| Other crypto assets | 26% |
Source: Coinbase
Coinbase Retail Trading Volume
Coinbase processed $43 billion worth of trades from retail customers in Q2 2025. That accounts for a 6.62% share of the total trading volume on the platform, with the remaining activity coming from institutional investors.
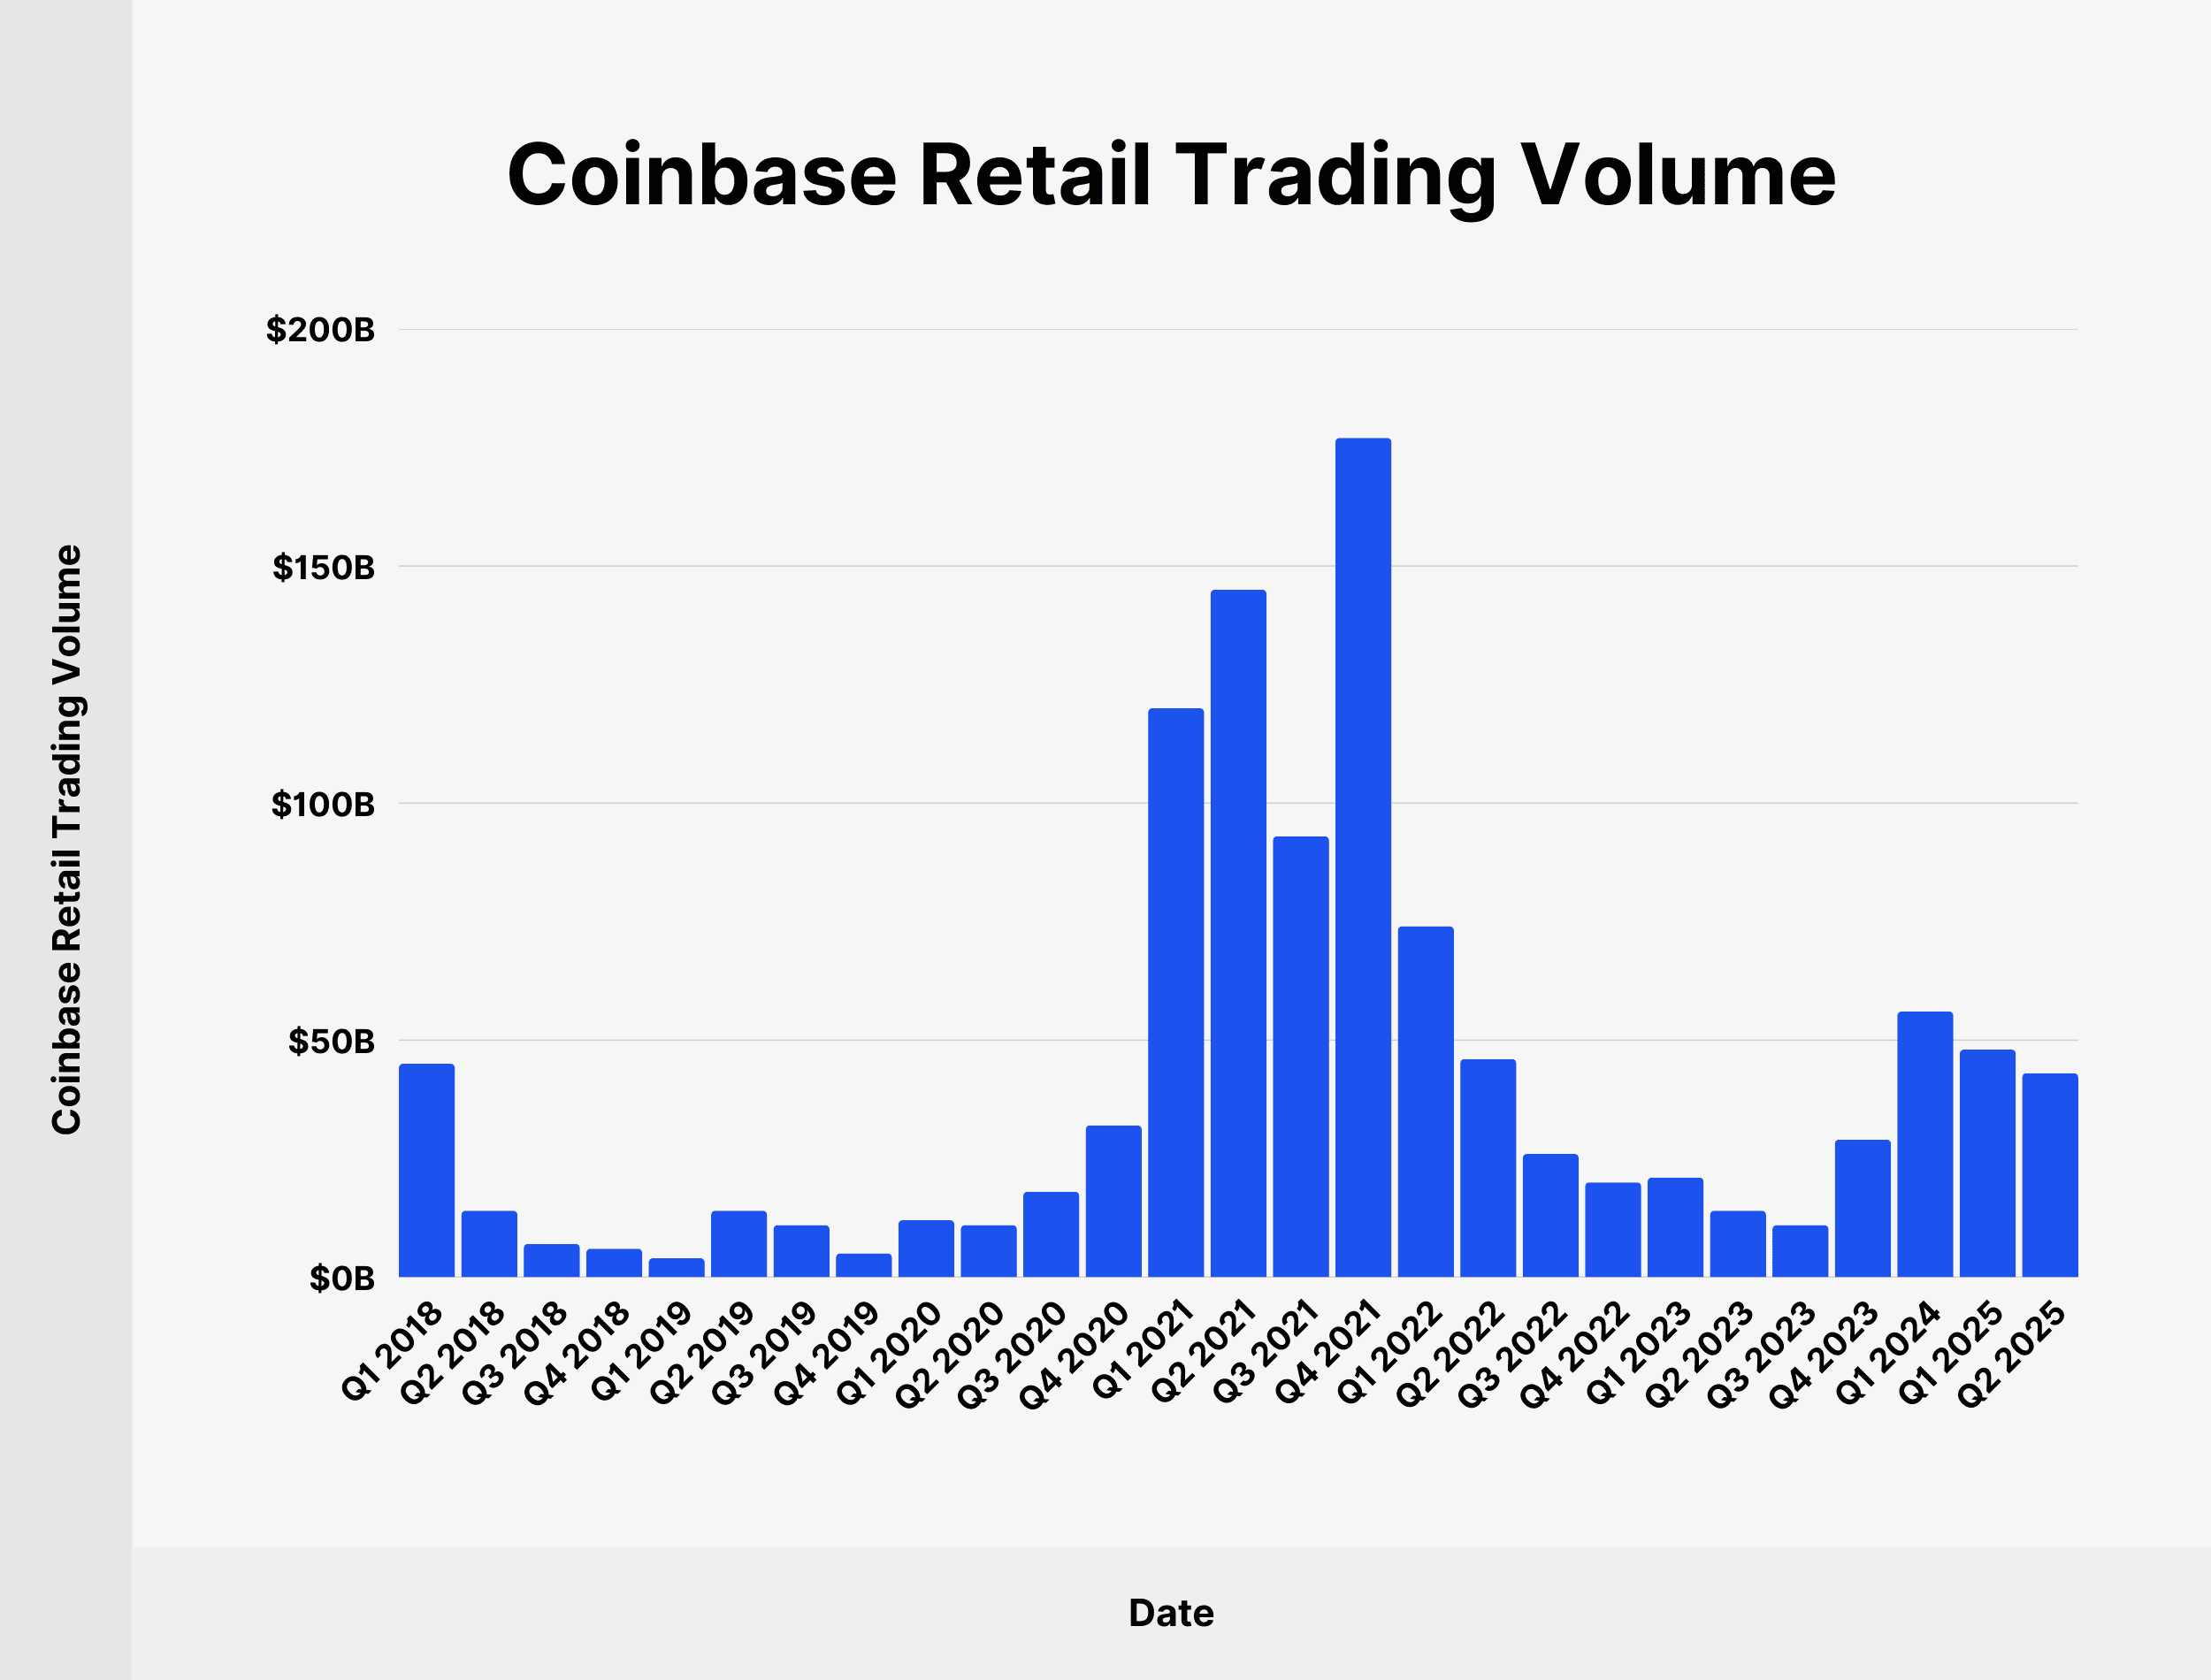
Here’s a complete overview of Coinbase retail trading volume since Q1 2018:
| Date | Coinbase Retail Trading Volume (Share of Total Trading Volume) |
|---|---|
| Q1 2018 | $45 billion (80.36%) |
| Q2 2018 | $14 billion (66.66%) |
| Q3 2018 | $7 billion (58.33%) |
| Q4 2018 | $6 billion (54.54%) |
| Q1 2019 | $4 billion (57.14%) |
| Q2 2019 | $14 billion (45.16%) |
| Q3 2019 | $11 billion (40.74%) |
| Q4 2019 | $5 billion (35.71%) |
| Q1 2020 | $12 billion (40%) |
| Q2 2020 | $11 billion (39.28%) |
| Q3 2020 | $18 billion (40%) |
| Q4 2020 | $32 billion (35.95%) |
| Q1 2021 | $120 billion (35.82%) |
| Q2 2021 | $145 billion (31.39%) |
| Q3 2021 | $93 billion (28.44%) |
| Q4 2021 | $177 billion (32.3%) |
| Q1 2022 | $74 billion (23.95%) |
| Q2 2022 | $46 billion (21.2%) |
| Q3 2022 | $26 billion (16.35%) |
| Q4 2022 | $20 billion (13.79%) |
| Q1 2023 | $21 billion (14.48%) |
| Q2 2023 | $14 billion (15.22%) |
| Q3 2023 | $11 billion (14.47%) |
| Q4 2023 | $29 billion (18.83%) |
| Q1 2024 | $56 billion (17.95%) |
| Q1 2025 | $48 billion (6.15%) |
| Q2 2025 | $43 billion (6.62%) |
Source: Coinbase
Coinbase Institutional Trading Volume
Institutional customers on Coinbase accounted for a trading volume of $194 billion in Q2 2025, which represents an 81.86% share of total trades.
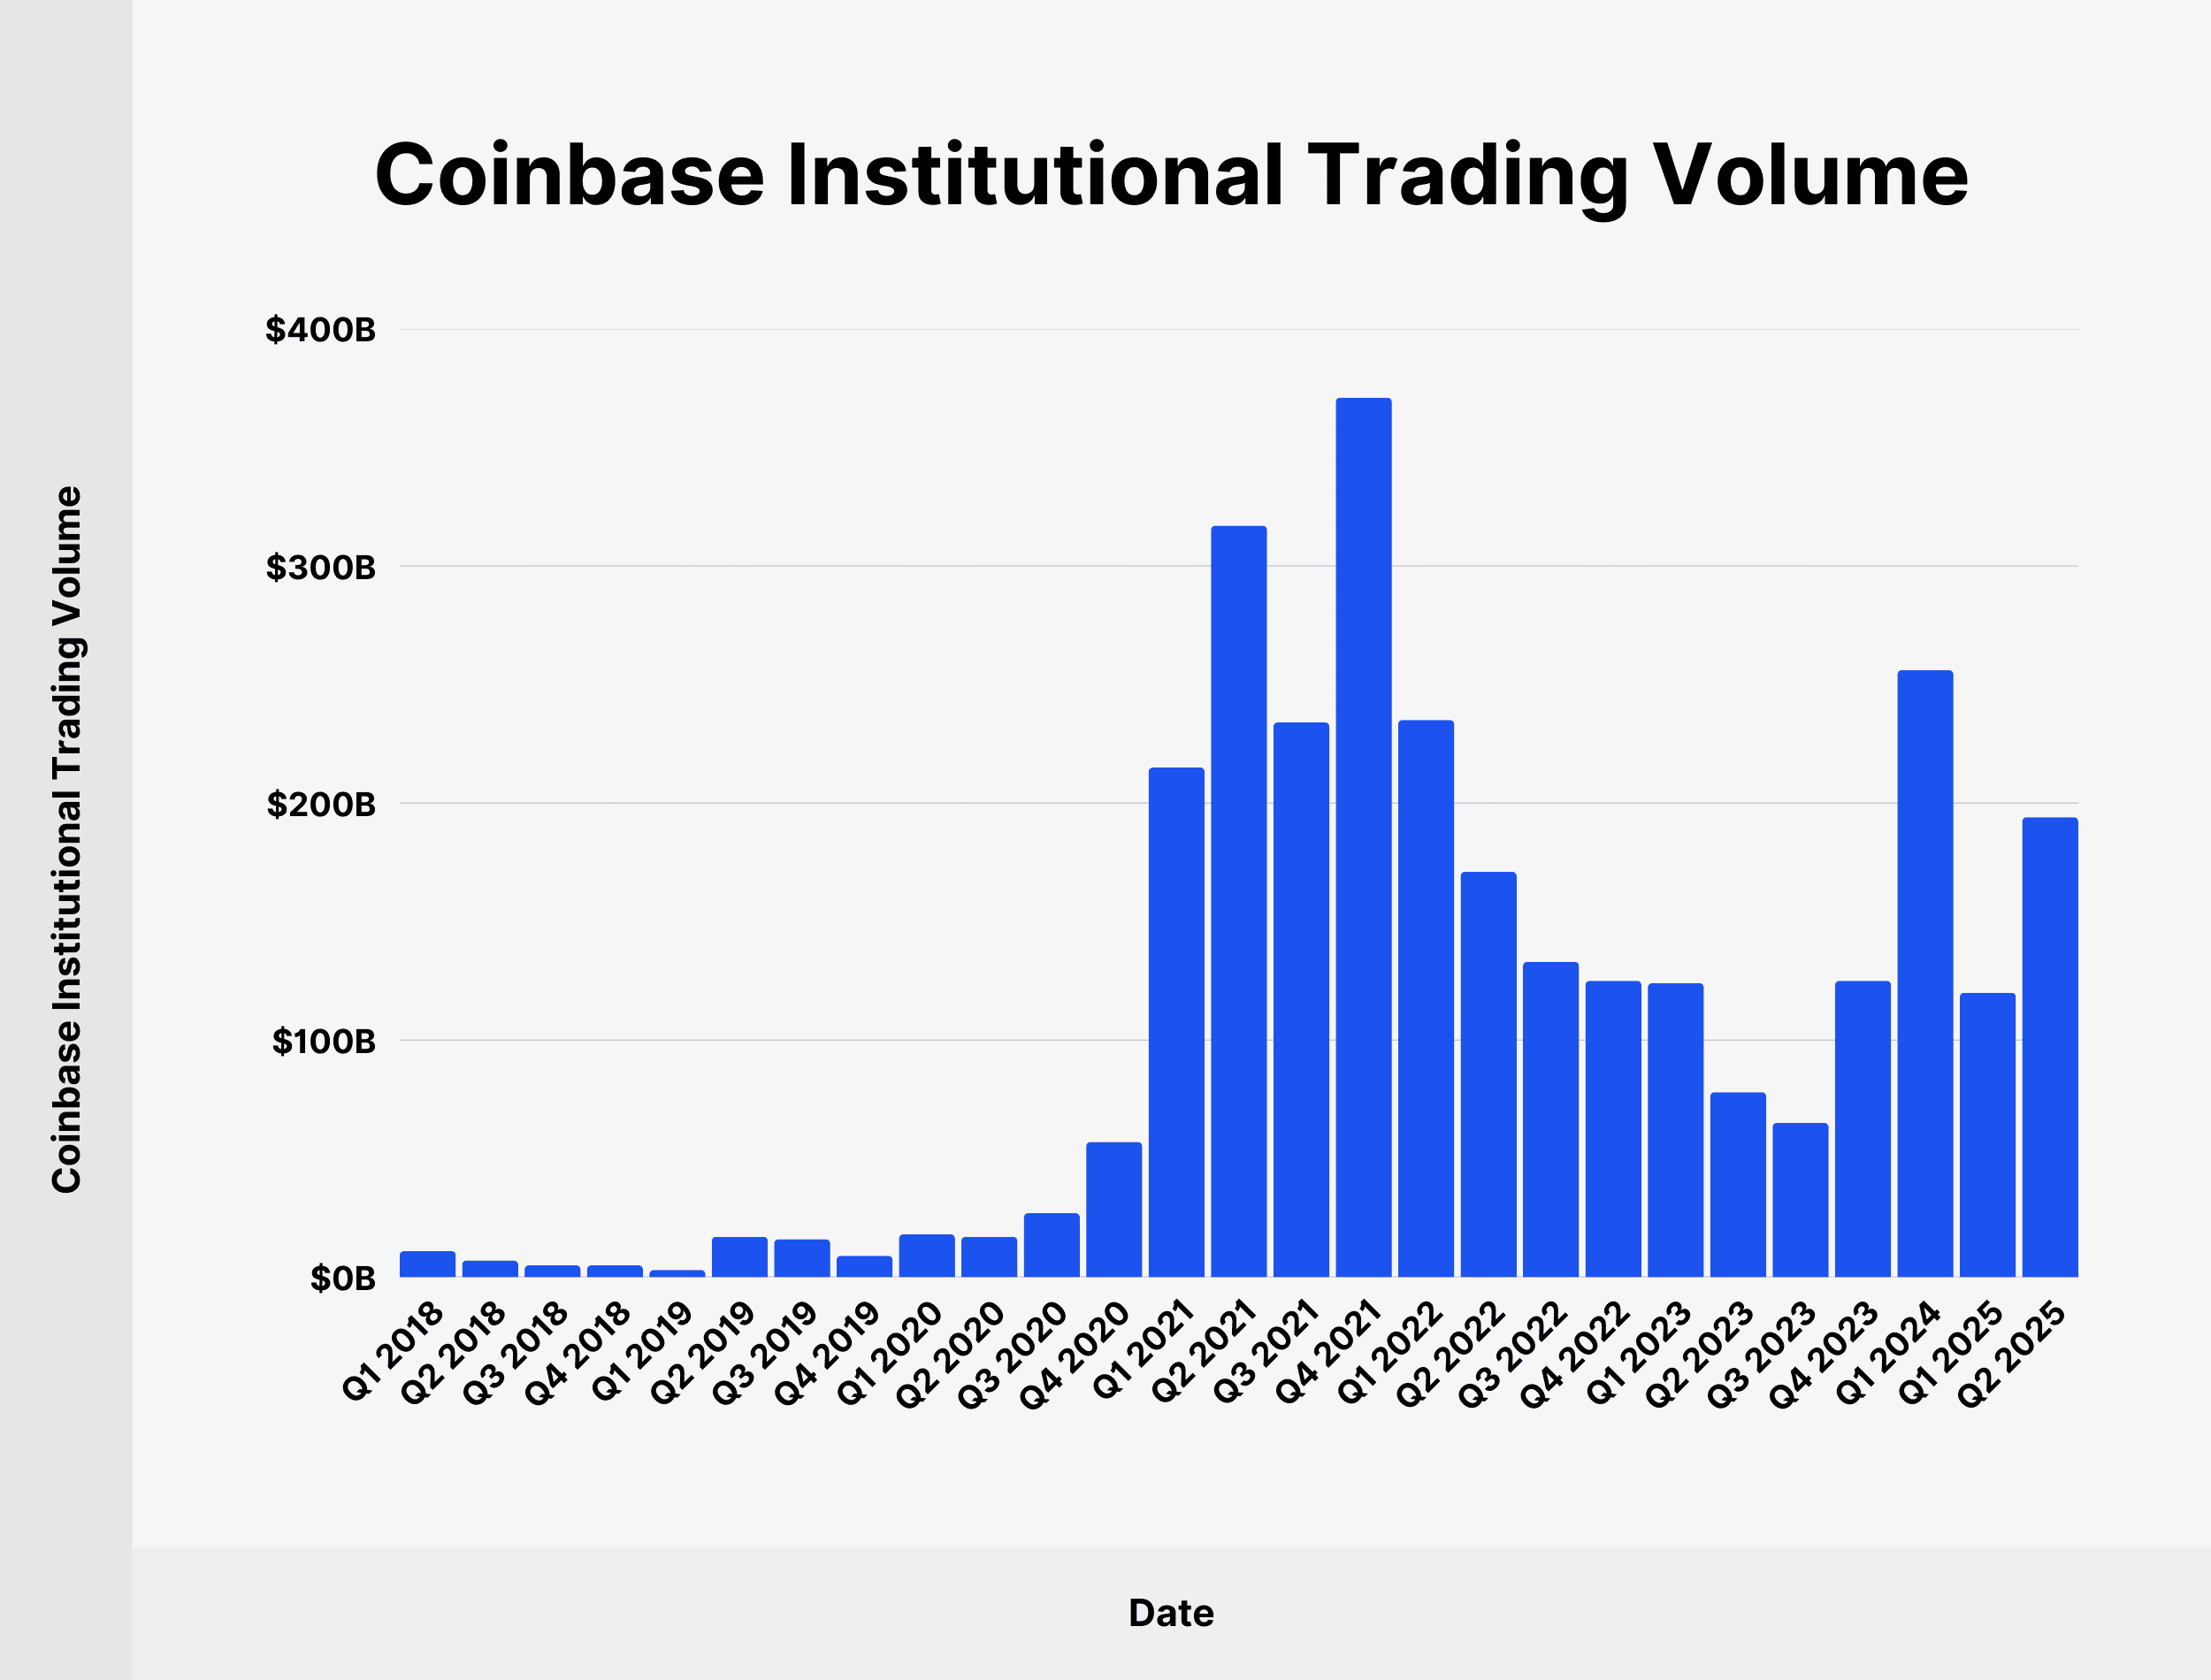
Institutional customers accounted for just 19.67% of total trading volume in Q1 2018. Since then, the figure has increased by over 4x.
We’ve charted institutional trading volume on Coinbase since the beginning of 2018:
| Date | Coinbase Institutional Trading Volume (Share of Total Trading Volume) |
|---|---|
| Q1 2018 | $11 billion (19.67%) |
| Q2 2018 | $7 billion (33.4%) |
| Q3 2018 | $5 billion (41.67%) |
| Q4 2018 | $5 billion (45.46%) |
| Q1 2019 | $3 billion (42.86%) |
| Q2 2019 | $17 billion (54.84%) |
| Q3 2019 | $16 billion (59.26%) |
| Q4 2019 | $9 billion (64.29%) |
| Q1 2020 | $18 billion (60%) |
| Q2 2020 | $17 billion (60.72%) |
| Q3 2020 | $27 billion (60%) |
| Q4 2020 | $57 billion (64.05%) |
| Q1 2021 | $215 billion (64.18%) |
| Q2 2021 | $317 billion (68.61%) |
| Q3 2021 | $234 billion (71.56%) |
| Q4 2021 | $371 billion (67.7%) |
| Q1 2022 | $235 billion (76.05%) |
| Q2 2022 | $171 billion (78.8%) |
| Q3 2022 | $133 billion (83.65%) |
| Q4 2022 | $125 billion (86.21%) |
| Q1 2023 | $124 billion (85.52%) |
| Q2 2023 | $78 billion (84.78%) |
| Q3 2023 | $65 billion (85.53%) |
| Q4 2023 | $125 billion (81.17%) |
| Q1 2024 | $256 billion (82.05%) |
| Q1 2025 | $120 billion (71.43%) |
| Q2 2025 | $120 billion (71.43%) |
What Are the Most Traded Currencies on Coinbase?
Bitcoin trades made up 34% of the total Coinbase trading volume in Q2 2025. That’s up from 29% in 2022.
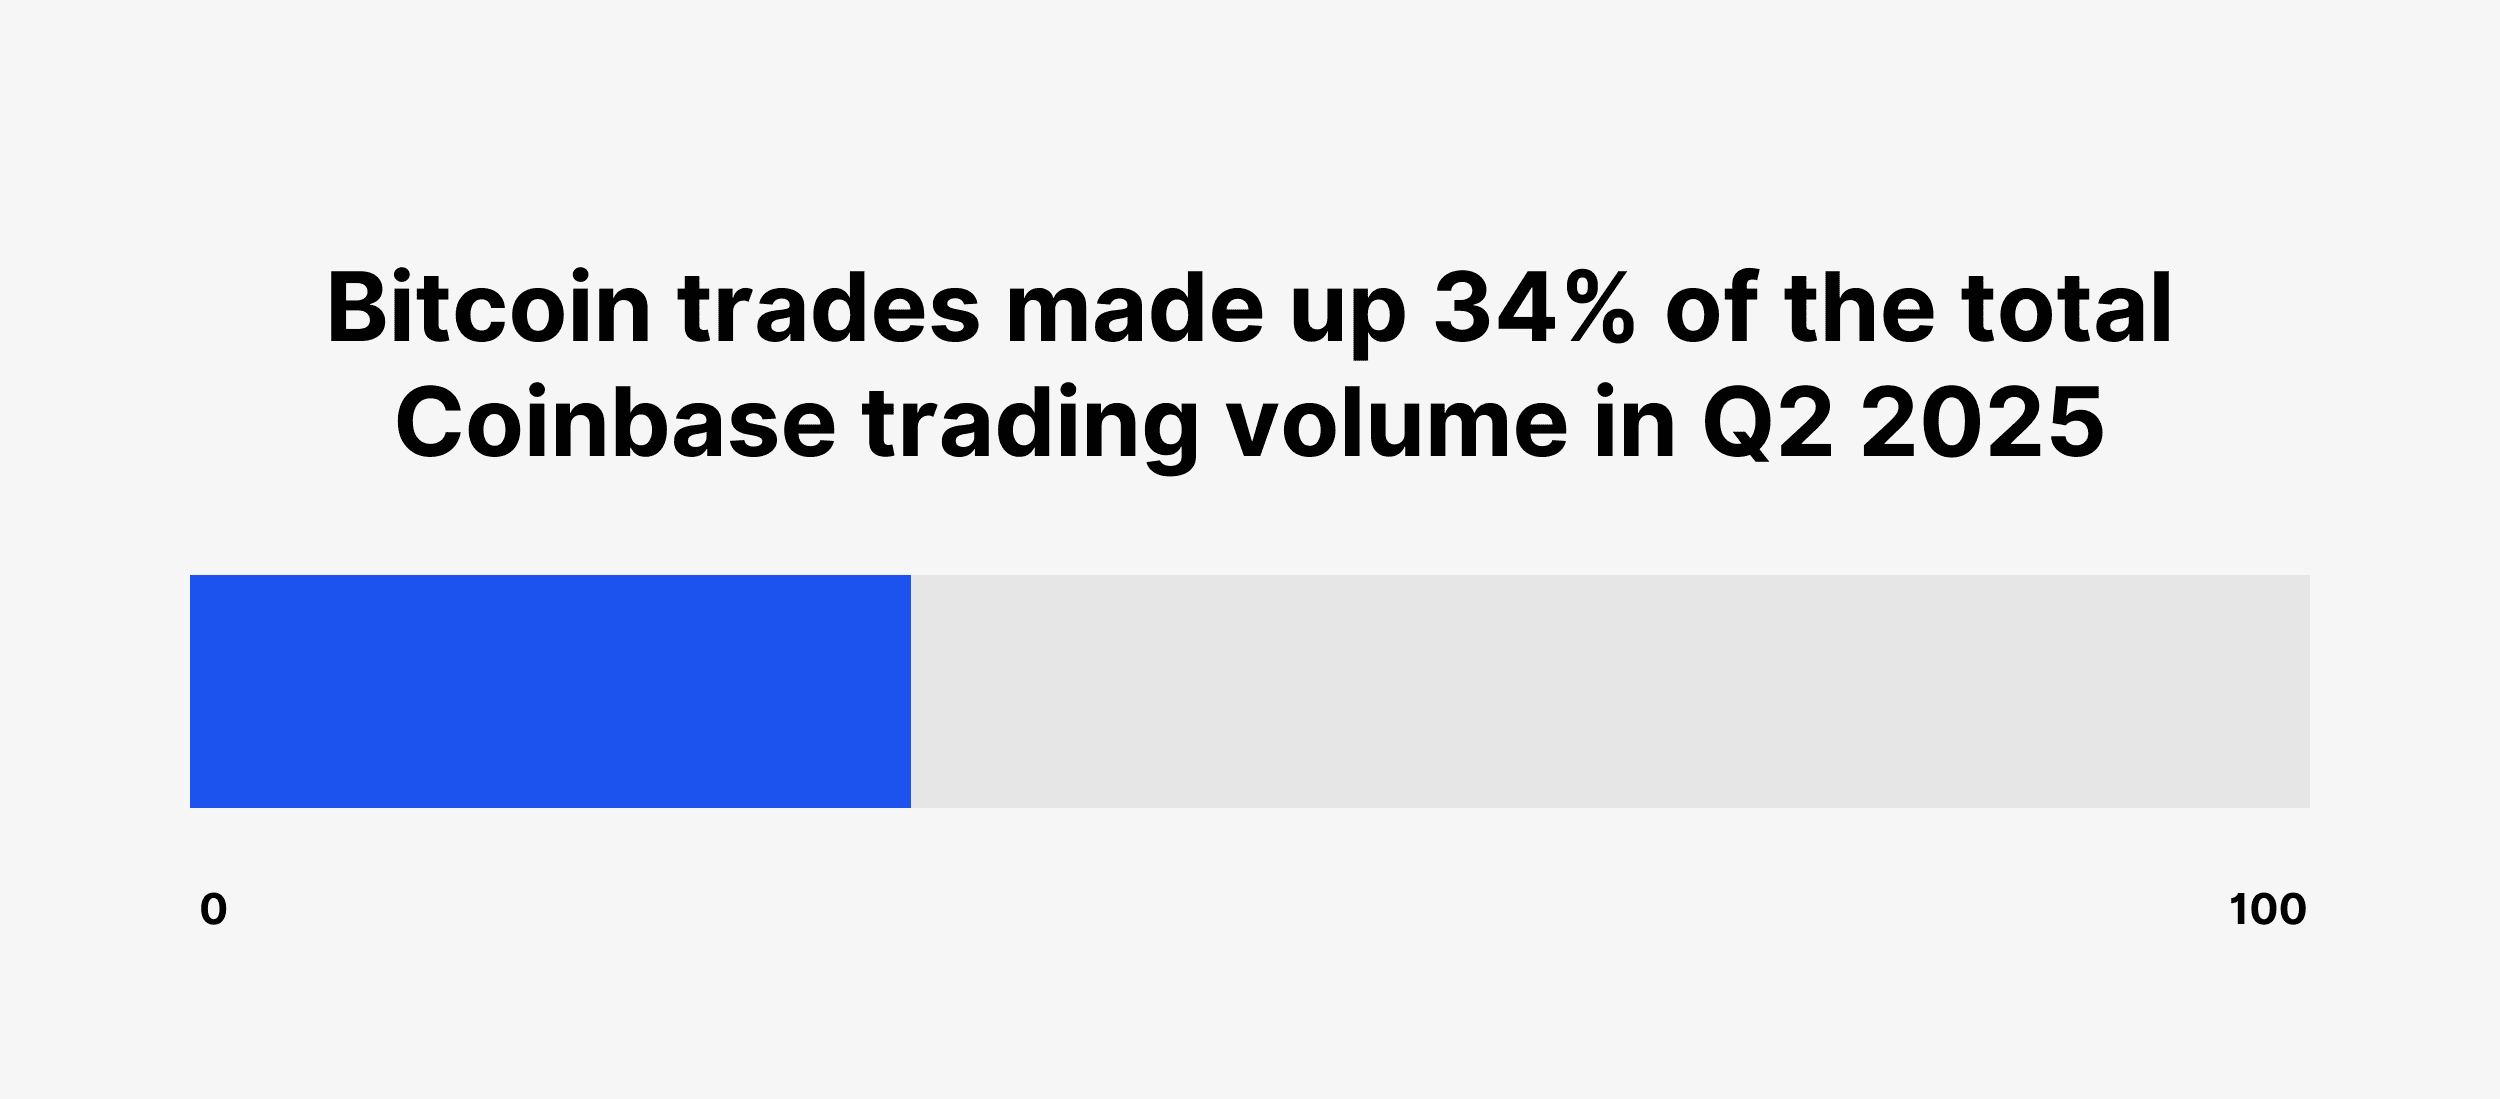
Here’s a detailed breakdown of Coinbase trade volume by asset since 2021:
| Asset | Share (2025) | Share (2024) | Share (2023) | Share (2022) | Share (2021) |
|---|---|---|---|---|---|
| Bitcoin | 34% | 33% | 34% | 29% | 24% |
| Ethereum | 12% | 13% | 20% | 25% | 21% |
| Other crypto assets | 54% | 54% | 46% | 46% | 55% |
Source: Coinbase
How Many Cryptocurrency Assets Are Supported on Coinbase?
Coinbase currently supports over 250 tradable assets on the platform.

Source: Coinbase
Coinbase Total Revenue
Coinbase generated $6.6 billion in 2024. That’s up from $3.11 billion in 2023.
In the first 3 months of 2025, Coinbase has already generated $2 billion in revenue.
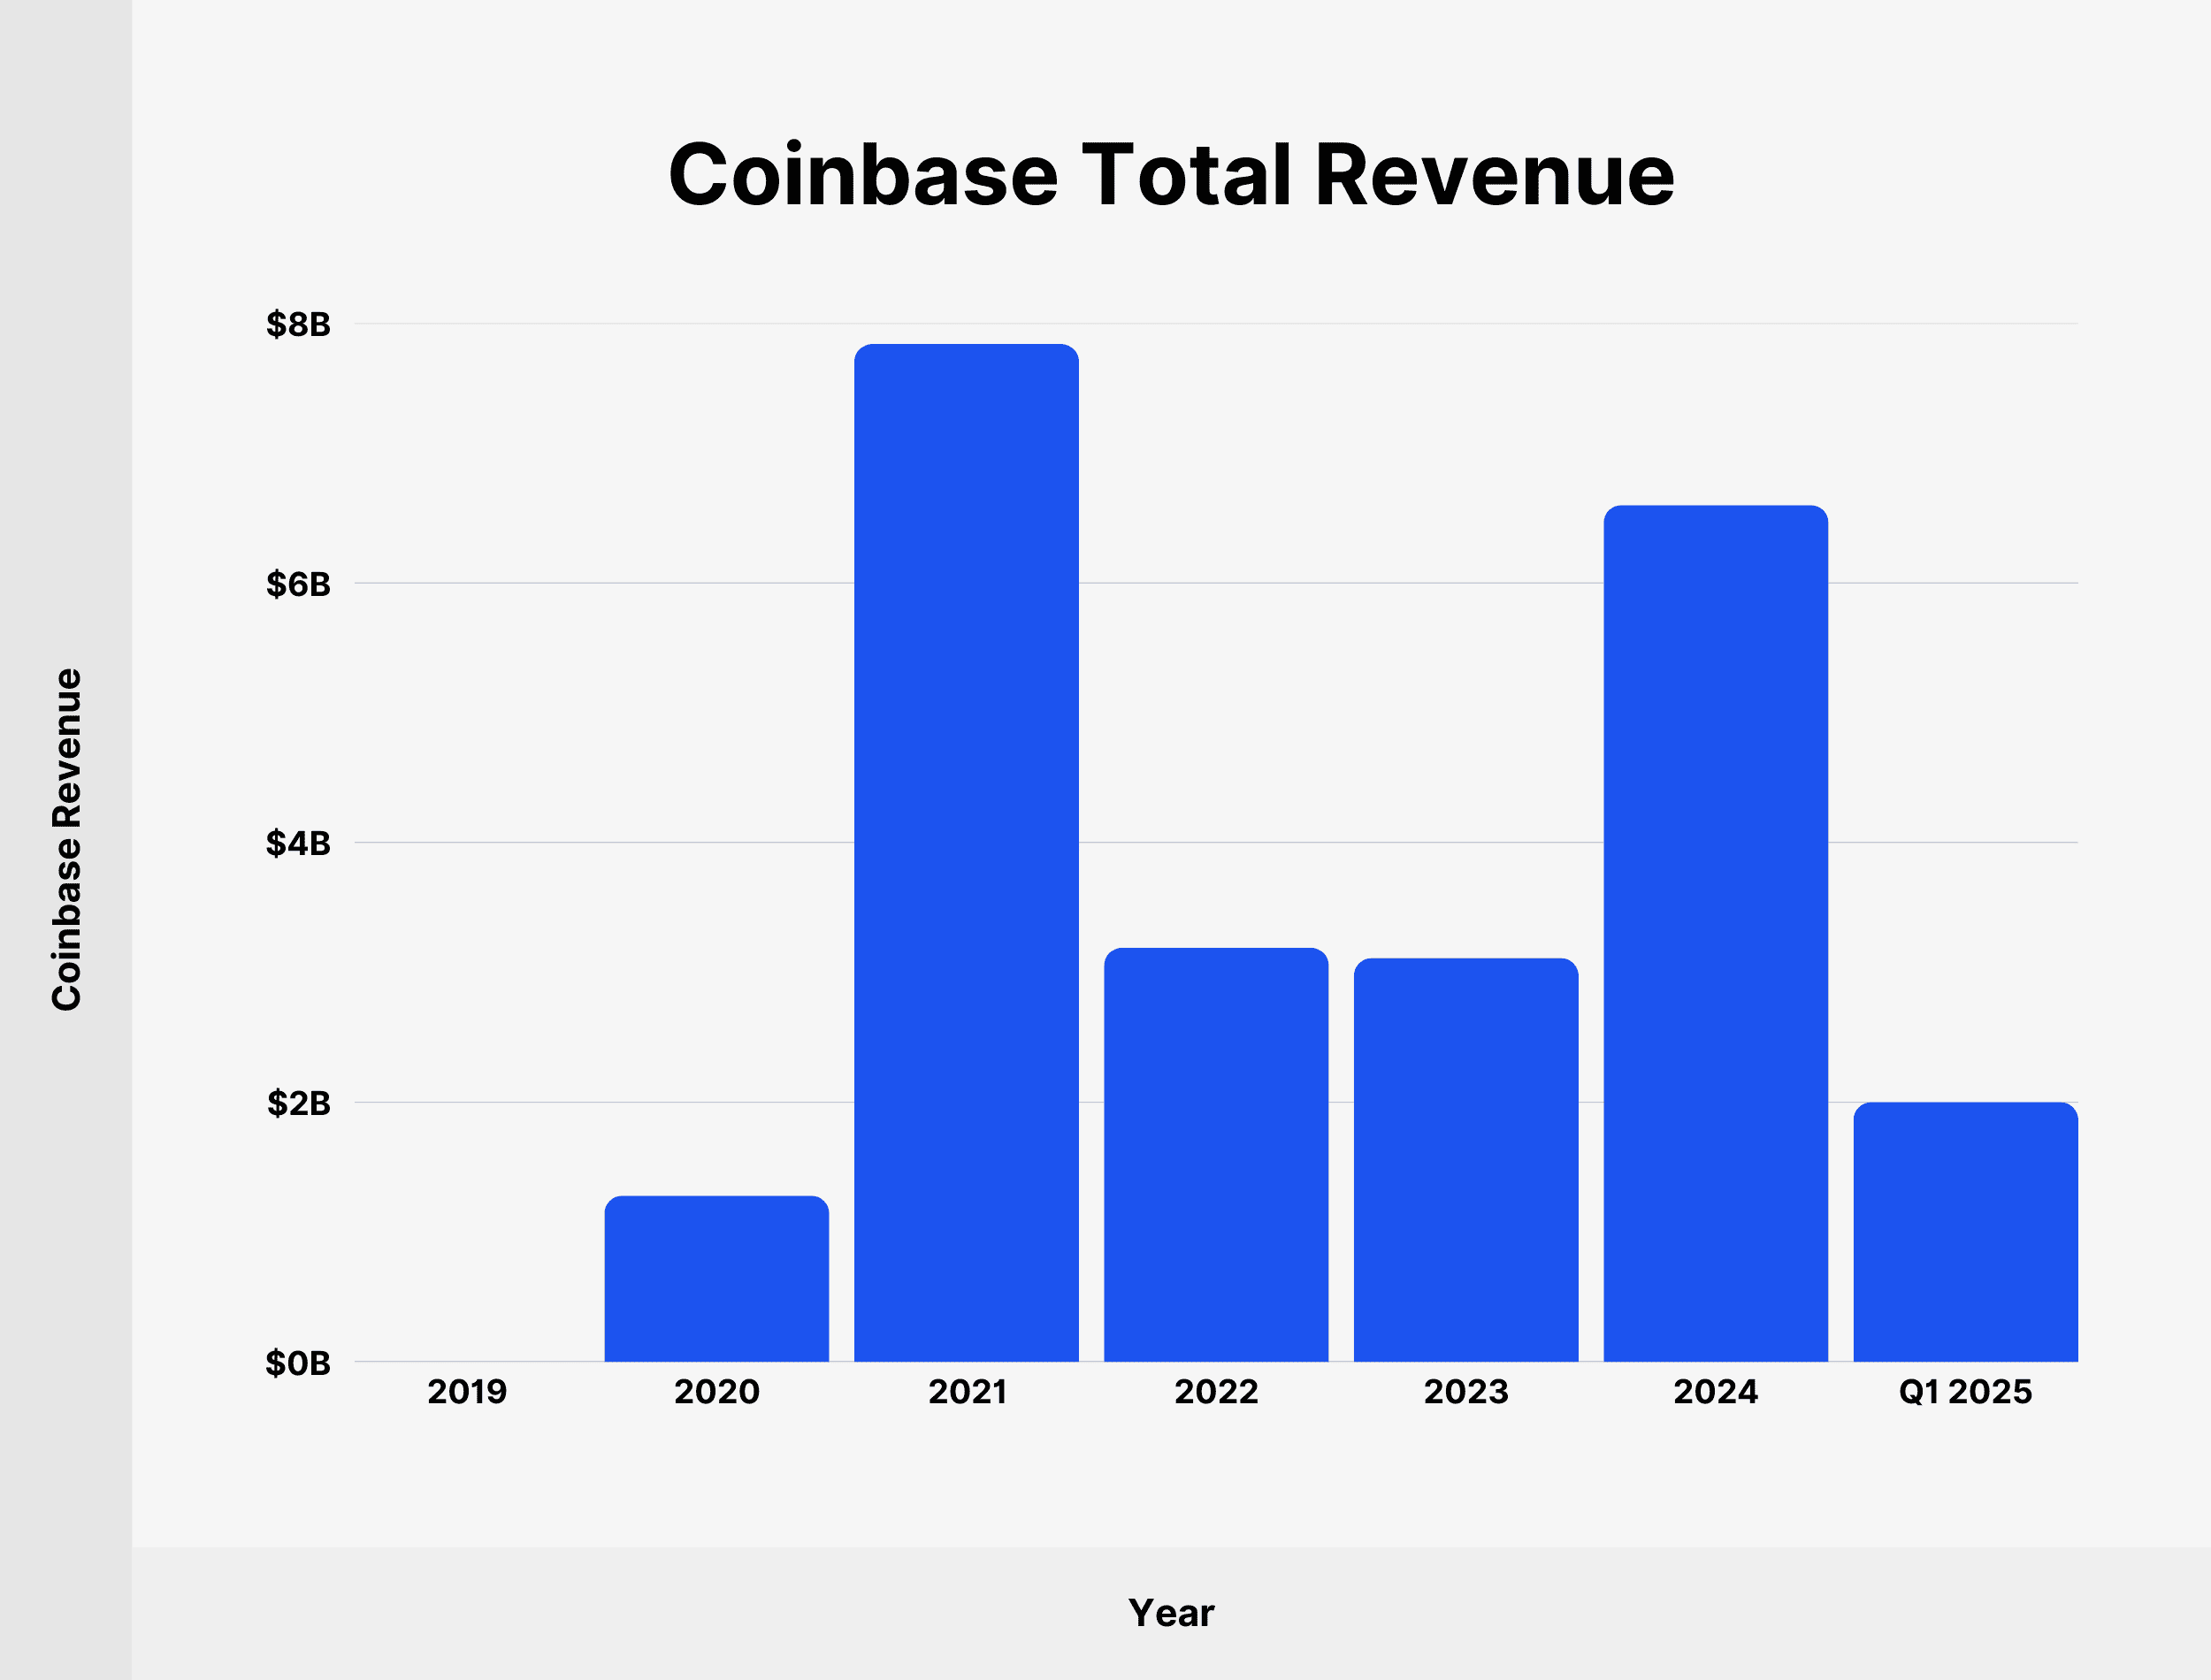
Here’s a table with Coinbase revenue since 2019:
| Year | Coinbase Revenue |
|---|---|
| 2019 | $533.73 million |
| 2020 | $1.28 billion |
| 2021 | $7.84 billion |
| 2022 | $3.19 billion |
| 2023 | $3.11 billion |
| 2024 | $6.6 billion |
| Q1 2025 | $2 billion |
Source: Coinbase
Coinbase Transaction Revenue
Coinbase generated $1.56 billion in transaction revenue in 2024. That’s a small increase from $1.52 billion in 2023.
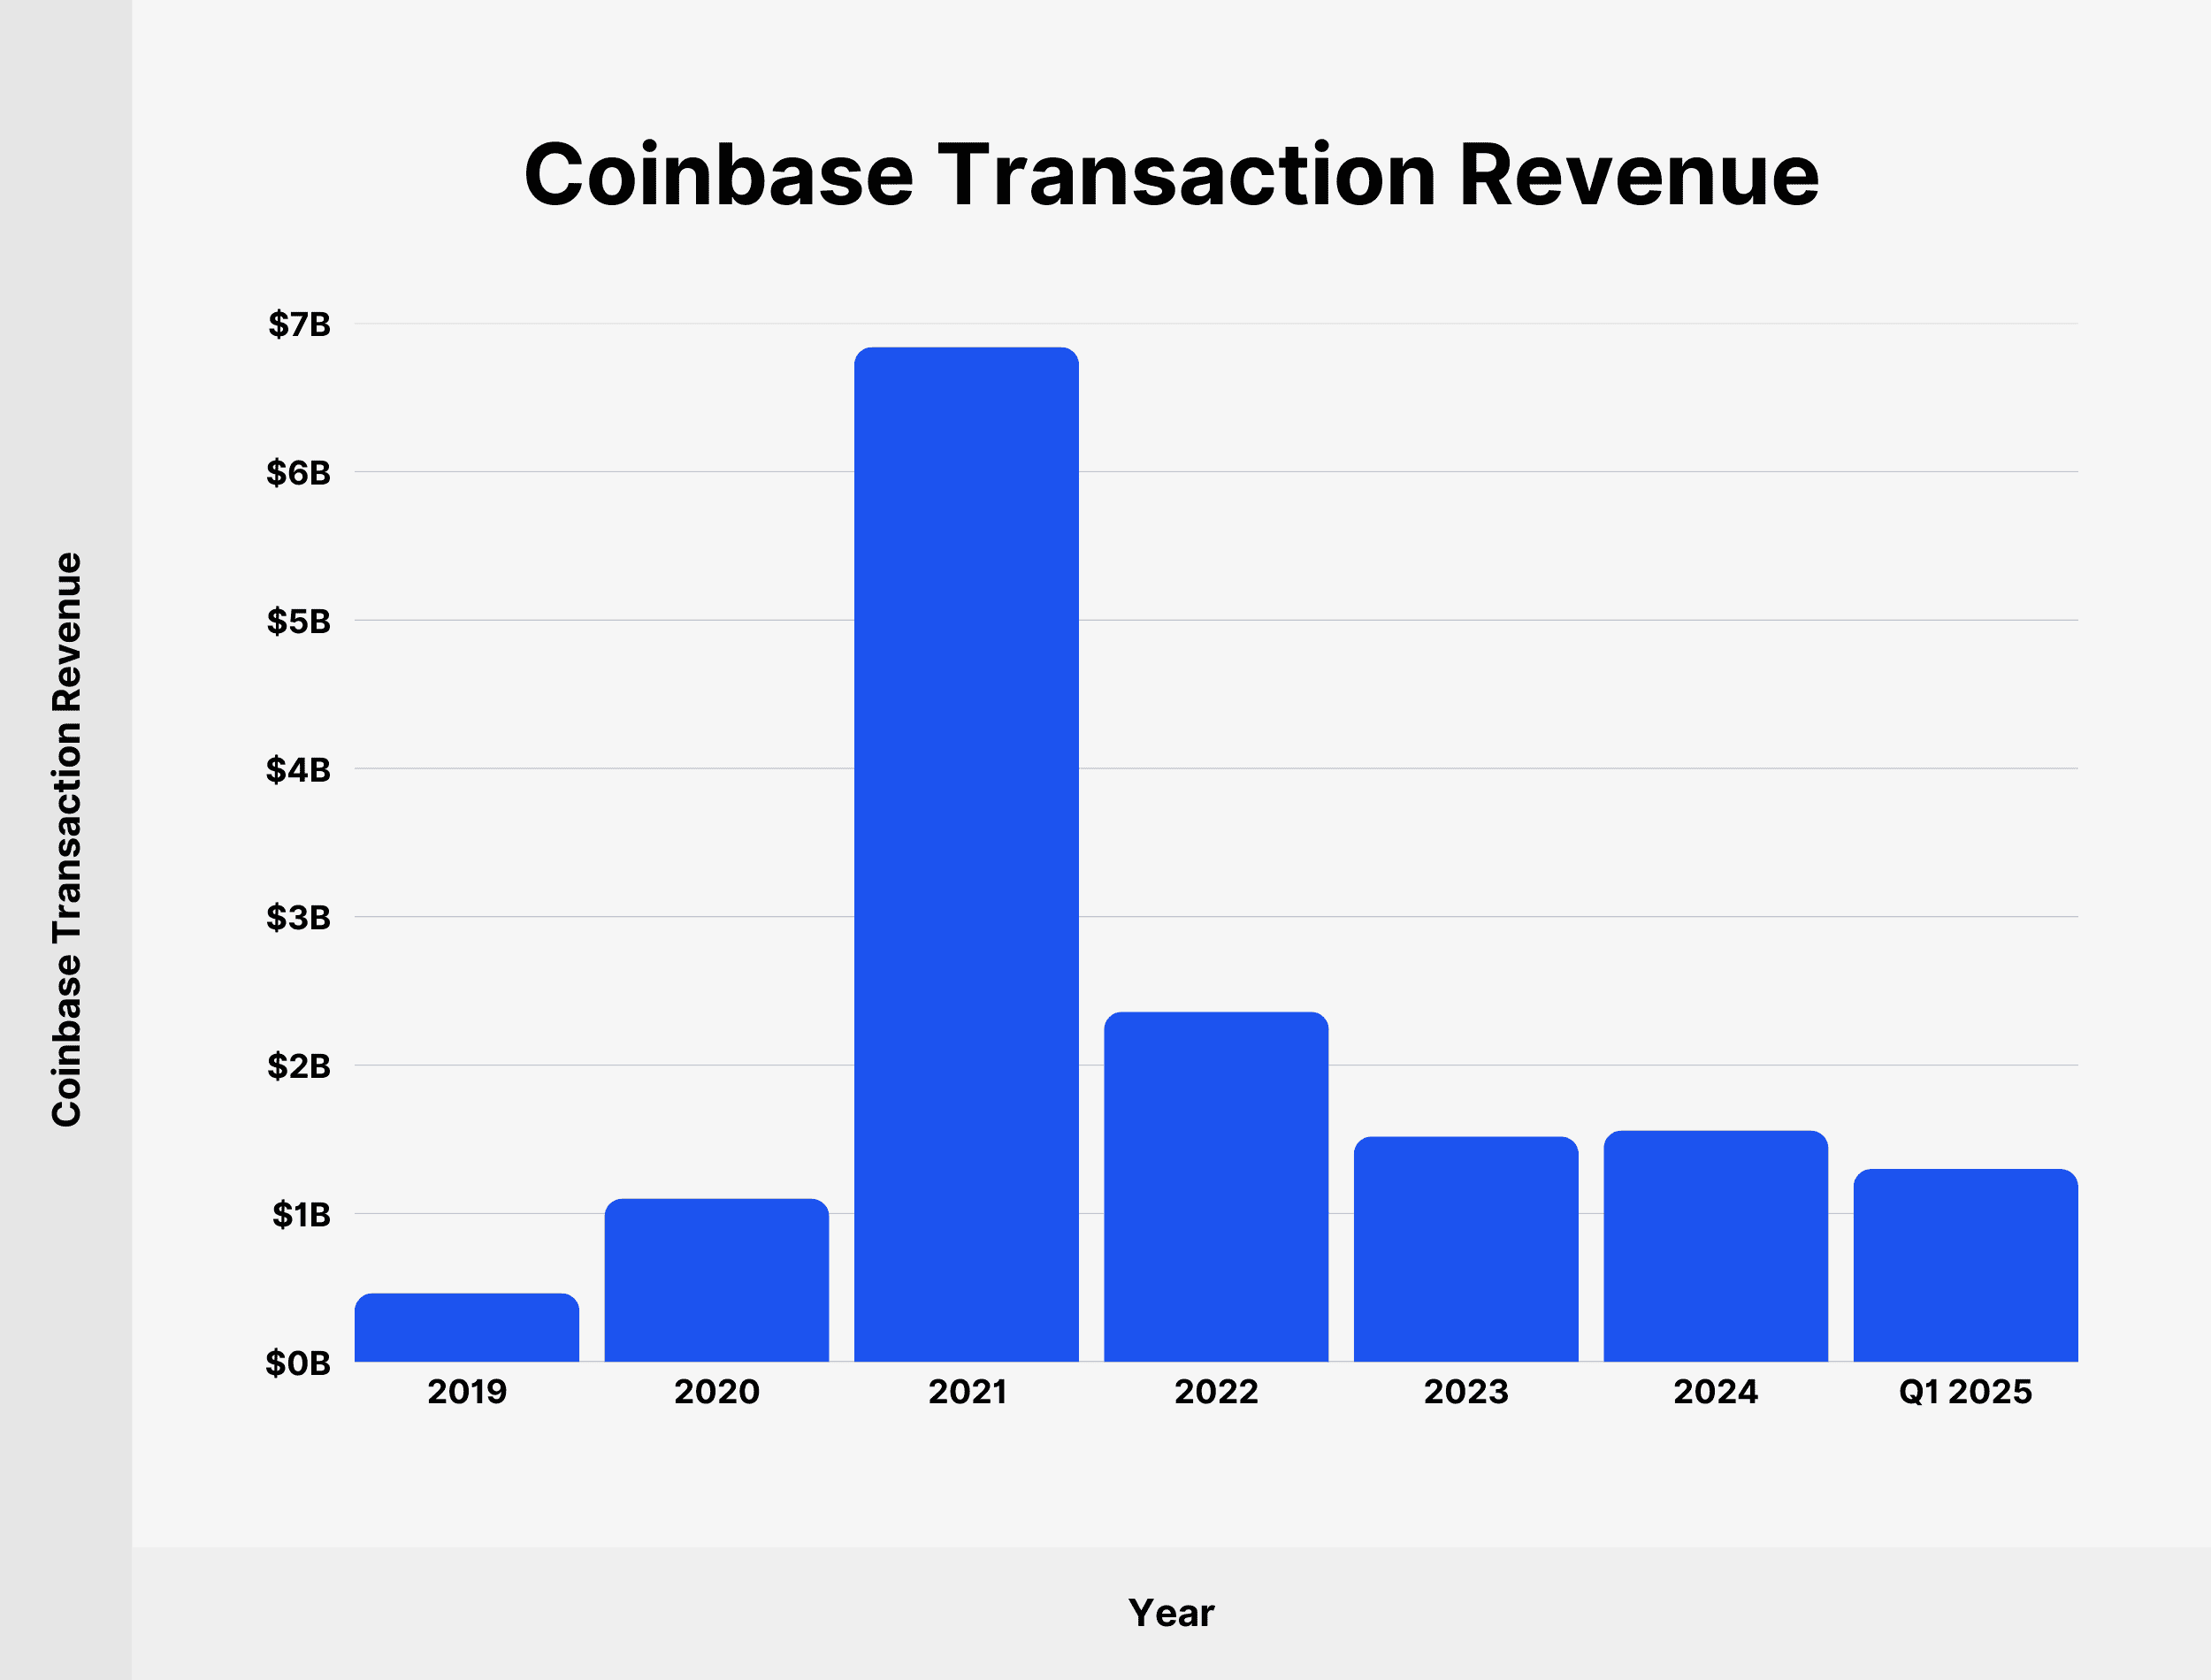
Here’s a table with Coinbase transaction revenue since 2019:
| Year | Coinbase Transaction Revenue |
|---|---|
| 2019 | $463 million |
| 2020 | $1.1 billion |
| 2021 | $6.84 billion |
| 2022 | $2.36 billion |
| 2023 | $1.52 billion |
| 2024 | $1.56 billion |
| Q1 2024 | $1.3 billion |
Source: Coinbase
Coinbase Subscription and Services Revenue
Coinbase subscription and services revenue consists of blockchain rewards, custodial fee revenue, earn campaign revenue, interest income, and subscription licenses.
Coinbase brought in $2.3 billion in subscription and services revenue in 2024. That’s up from $1.41 billion in 2023.
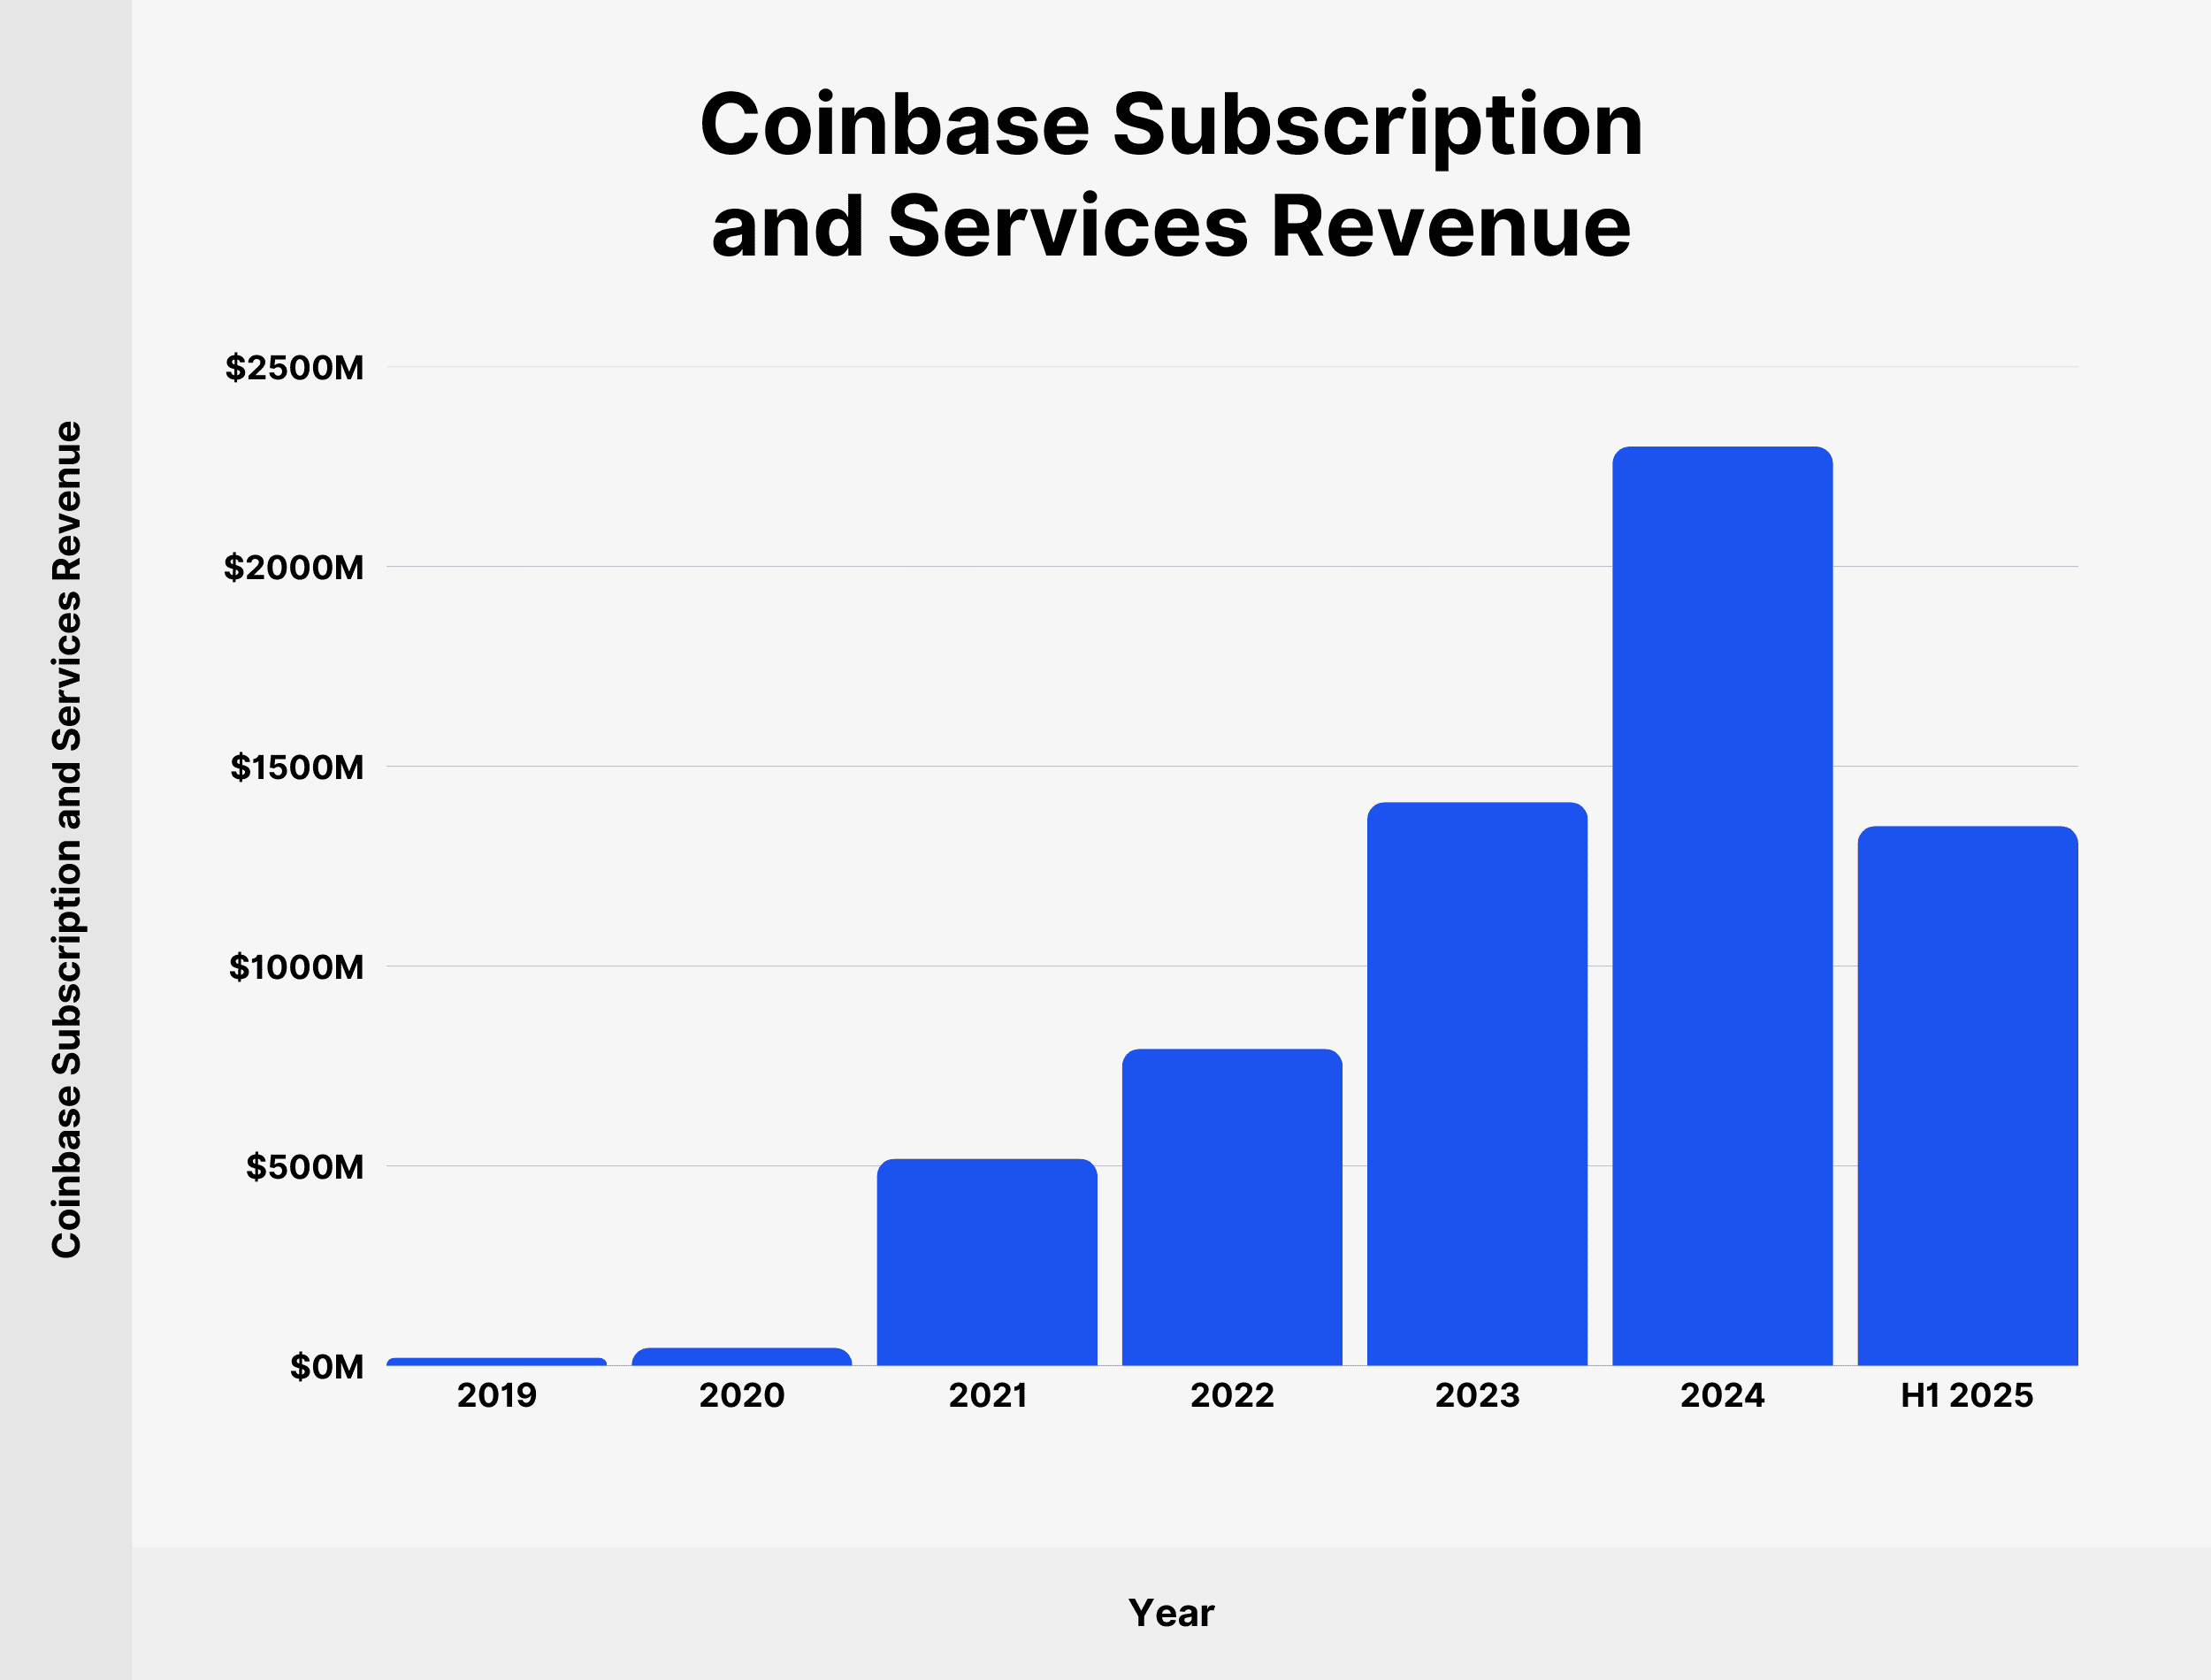
We’ve charted Coinbase subscription and services revenue since 2019:
| Year | Coinbase Subscription and Services Revenue |
|---|---|
| 2019 | $19.94 million |
| 2020 | $44.99 million |
| 2021 | $517.49 million |
| 2022 | $792.57 million |
| 2023 | $1.41 billion |
| 2024 | $2.3 billion |
| H1 2025 | $1.35 billion |
Source: Coinbase
How Many People Work at Coinbase?
Coinbase had 3,772 employees in December 2024. Since December 2023, Coinbase has increased its headcount by 356 employees.

Here’s a table showing the number of employees at Coinbase since 2020:
| Year | Coinbase Employees |
|---|---|
| 2020 | 1,249 |
| 2021 | 3,730 |
| 2022 | 4,510 |
| 2023 | 3,416 |
| 2023 | 3,772 |
Source: Coinbase
Conclusion
That’s it for my list of Coinbase stats in 2026.
Coinbase remains one of the leading crypto platforms today, but its revenues are down from peak crypto activity in 2021. It will be interesting to see whether Coinbase will be able to resume its rapid growth as before.
Backlinko is owned by Semrush. We’re still obsessed with bringing you world-class SEO insights, backed by hands-on experience. Unless otherwise noted, this content was written by either an employee or paid contractor of Semrush Inc.

