Uber is the leading global rideshare app. The service is available in more than 15,000 cities across 70 countries.
The company exploded to prominence following its foundation in 2009, hitting $1 billion in annualized gross bookings within 16 months.
Today, 180 million customers use the Uber platform. 8.8 million drivers serve the growing user base.
Uber processed $44.94 billion in gross bookings from its ridesharing business in Q1-Q2 2025.
Continue reading to find the latest data on Uber in 2025.
Key Uber Stats
- Uber has 180 million active users.
- Uber processed $44.94 billion worth of bookings in Q1-Q2 2025.
- 3.27 billion trips were completed through Uber in Q2 2025 alone.
- Uber has a 76% share of the US rideshare market.
- Uber currently has 31,100 employees.
Uber Monthly Active Users
Uber defines monthly active platform consumers (MAPCs) as the number of unique customers who complete a ride or receive a meal delivery through Uber at least once a month. The monthly average is calculated on a quarterly basis.
As of June 2025, Uber had 180 million monthly active platform consumers. Compared to a year ago (Q2 2024), the number of monthly users has increased by 15.38%
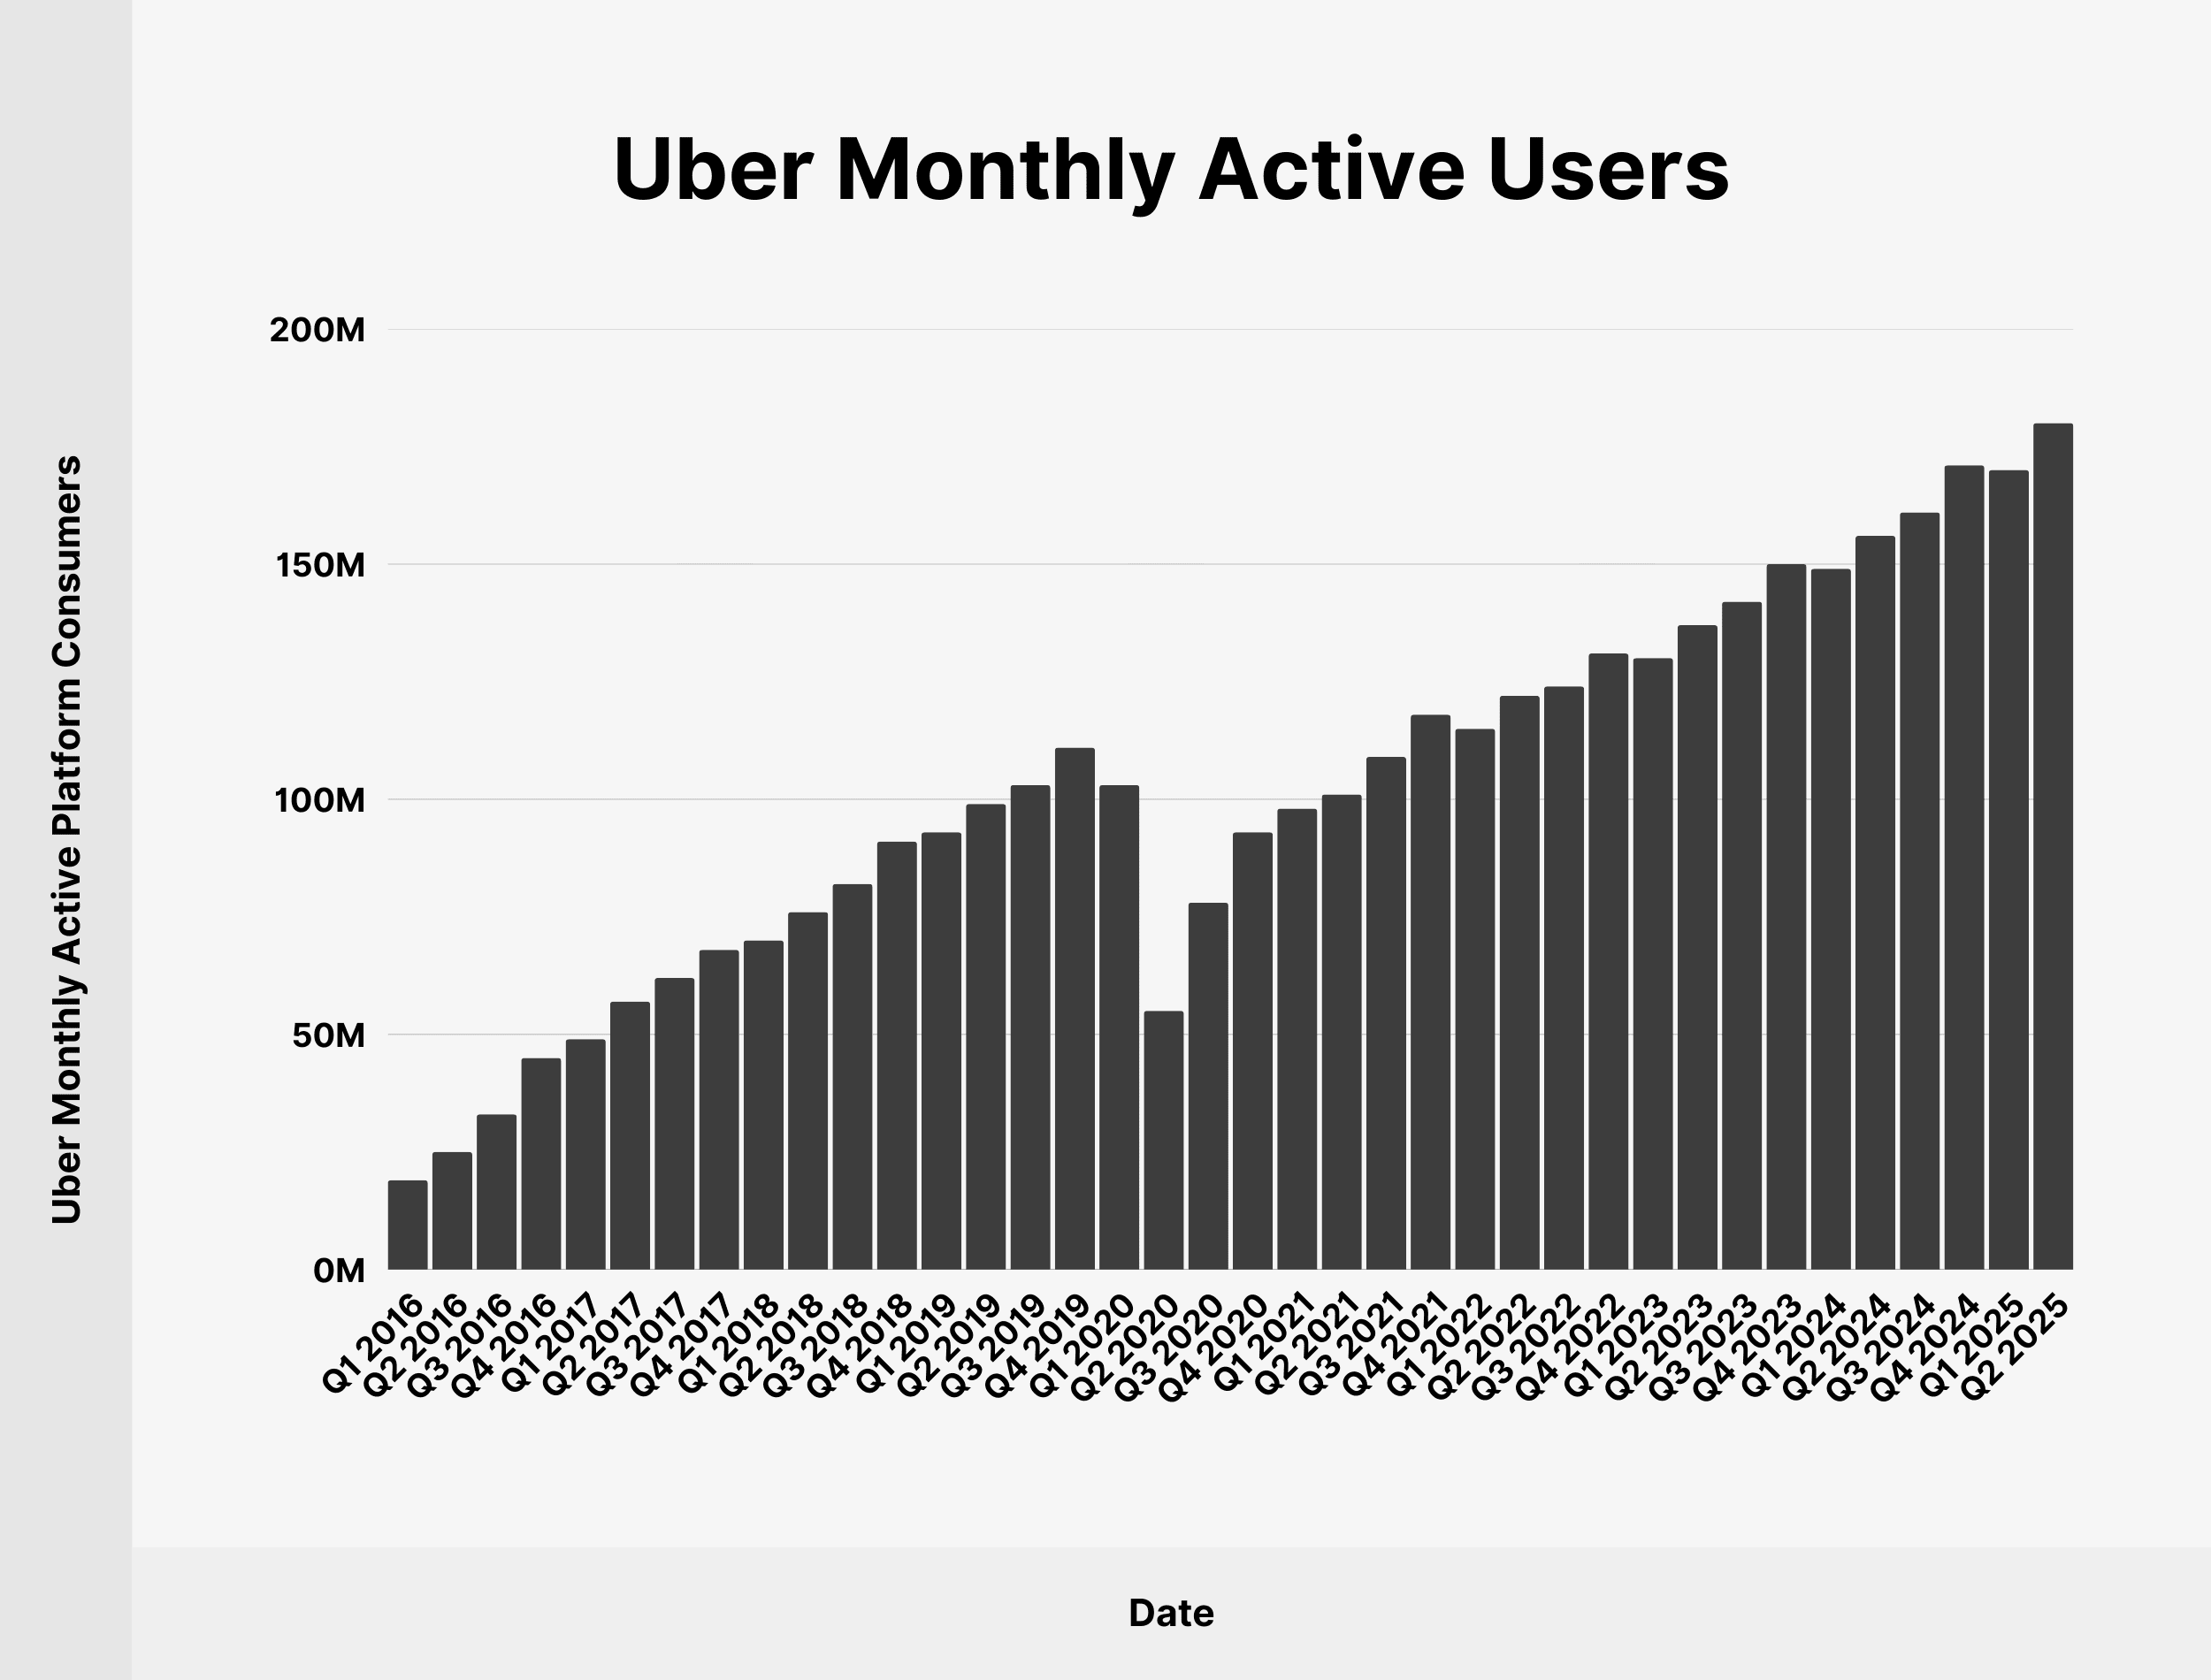
We’ve charted the growth in Uber’s monthly active platform consumers since Q1 2016:
| Date | Uber Monthly Active Platform Consumers |
|---|---|
| Q1 2016 | 19 million |
| Q2 2016 | 25 million |
| Q3 2016 | 33 million |
| Q4 2016 | 45 million |
| Q1 2017 | 49 million |
| Q2 2017 | 57 million |
| Q3 2017 | 62 million |
| Q4 2017 | 68 million |
| Q1 2018 | 70 million |
| Q2 2018 | 76 million |
| Q3 2018 | 82 million |
| Q4 2018 | 91 million |
| Q1 2019 | 93 million |
| Q2 2019 | 99 million |
| Q3 2019 | 103 million |
| Q4 2019 | 111 million |
| Q1 2020 | 103 million |
| Q2 2020 | 55 million |
| Q3 2020 | 78 million |
| Q4 2020 | 93 million |
| Q1 2021 | 98 million |
| Q2 2021 | 101 million |
| Q3 2021 | 109 million |
| Q4 2021 | 118 million |
| Q1 2022 | 115 million |
| Q2 2022 | 122 million |
| Q3 2022 | 124 million |
| Q4 2022 | 131 million |
| Q1 2023 | 130 million |
| Q2 2023 | 137 million |
| Q3 2023 | 142 million |
| Q4 2023 | 150 million |
| Q1 2024 | 149 million |
| Q2 2024 | 156 million |
| Q3 2024 | 161 million |
| Q4 2024 | 171 million |
| Q1 2025 | 170 million |
| Q2 2025 | 180 million |
Source: Uber
Uber Gross Mobility Bookings
Uber defines the mobility segment of its business as any service which links customers to “mobility drivers”. Essentially, the term refers to the ride-hailing part of Uber’s model.
Uber processed $23.76 billion in gross mobility bookings in Q2 2025.
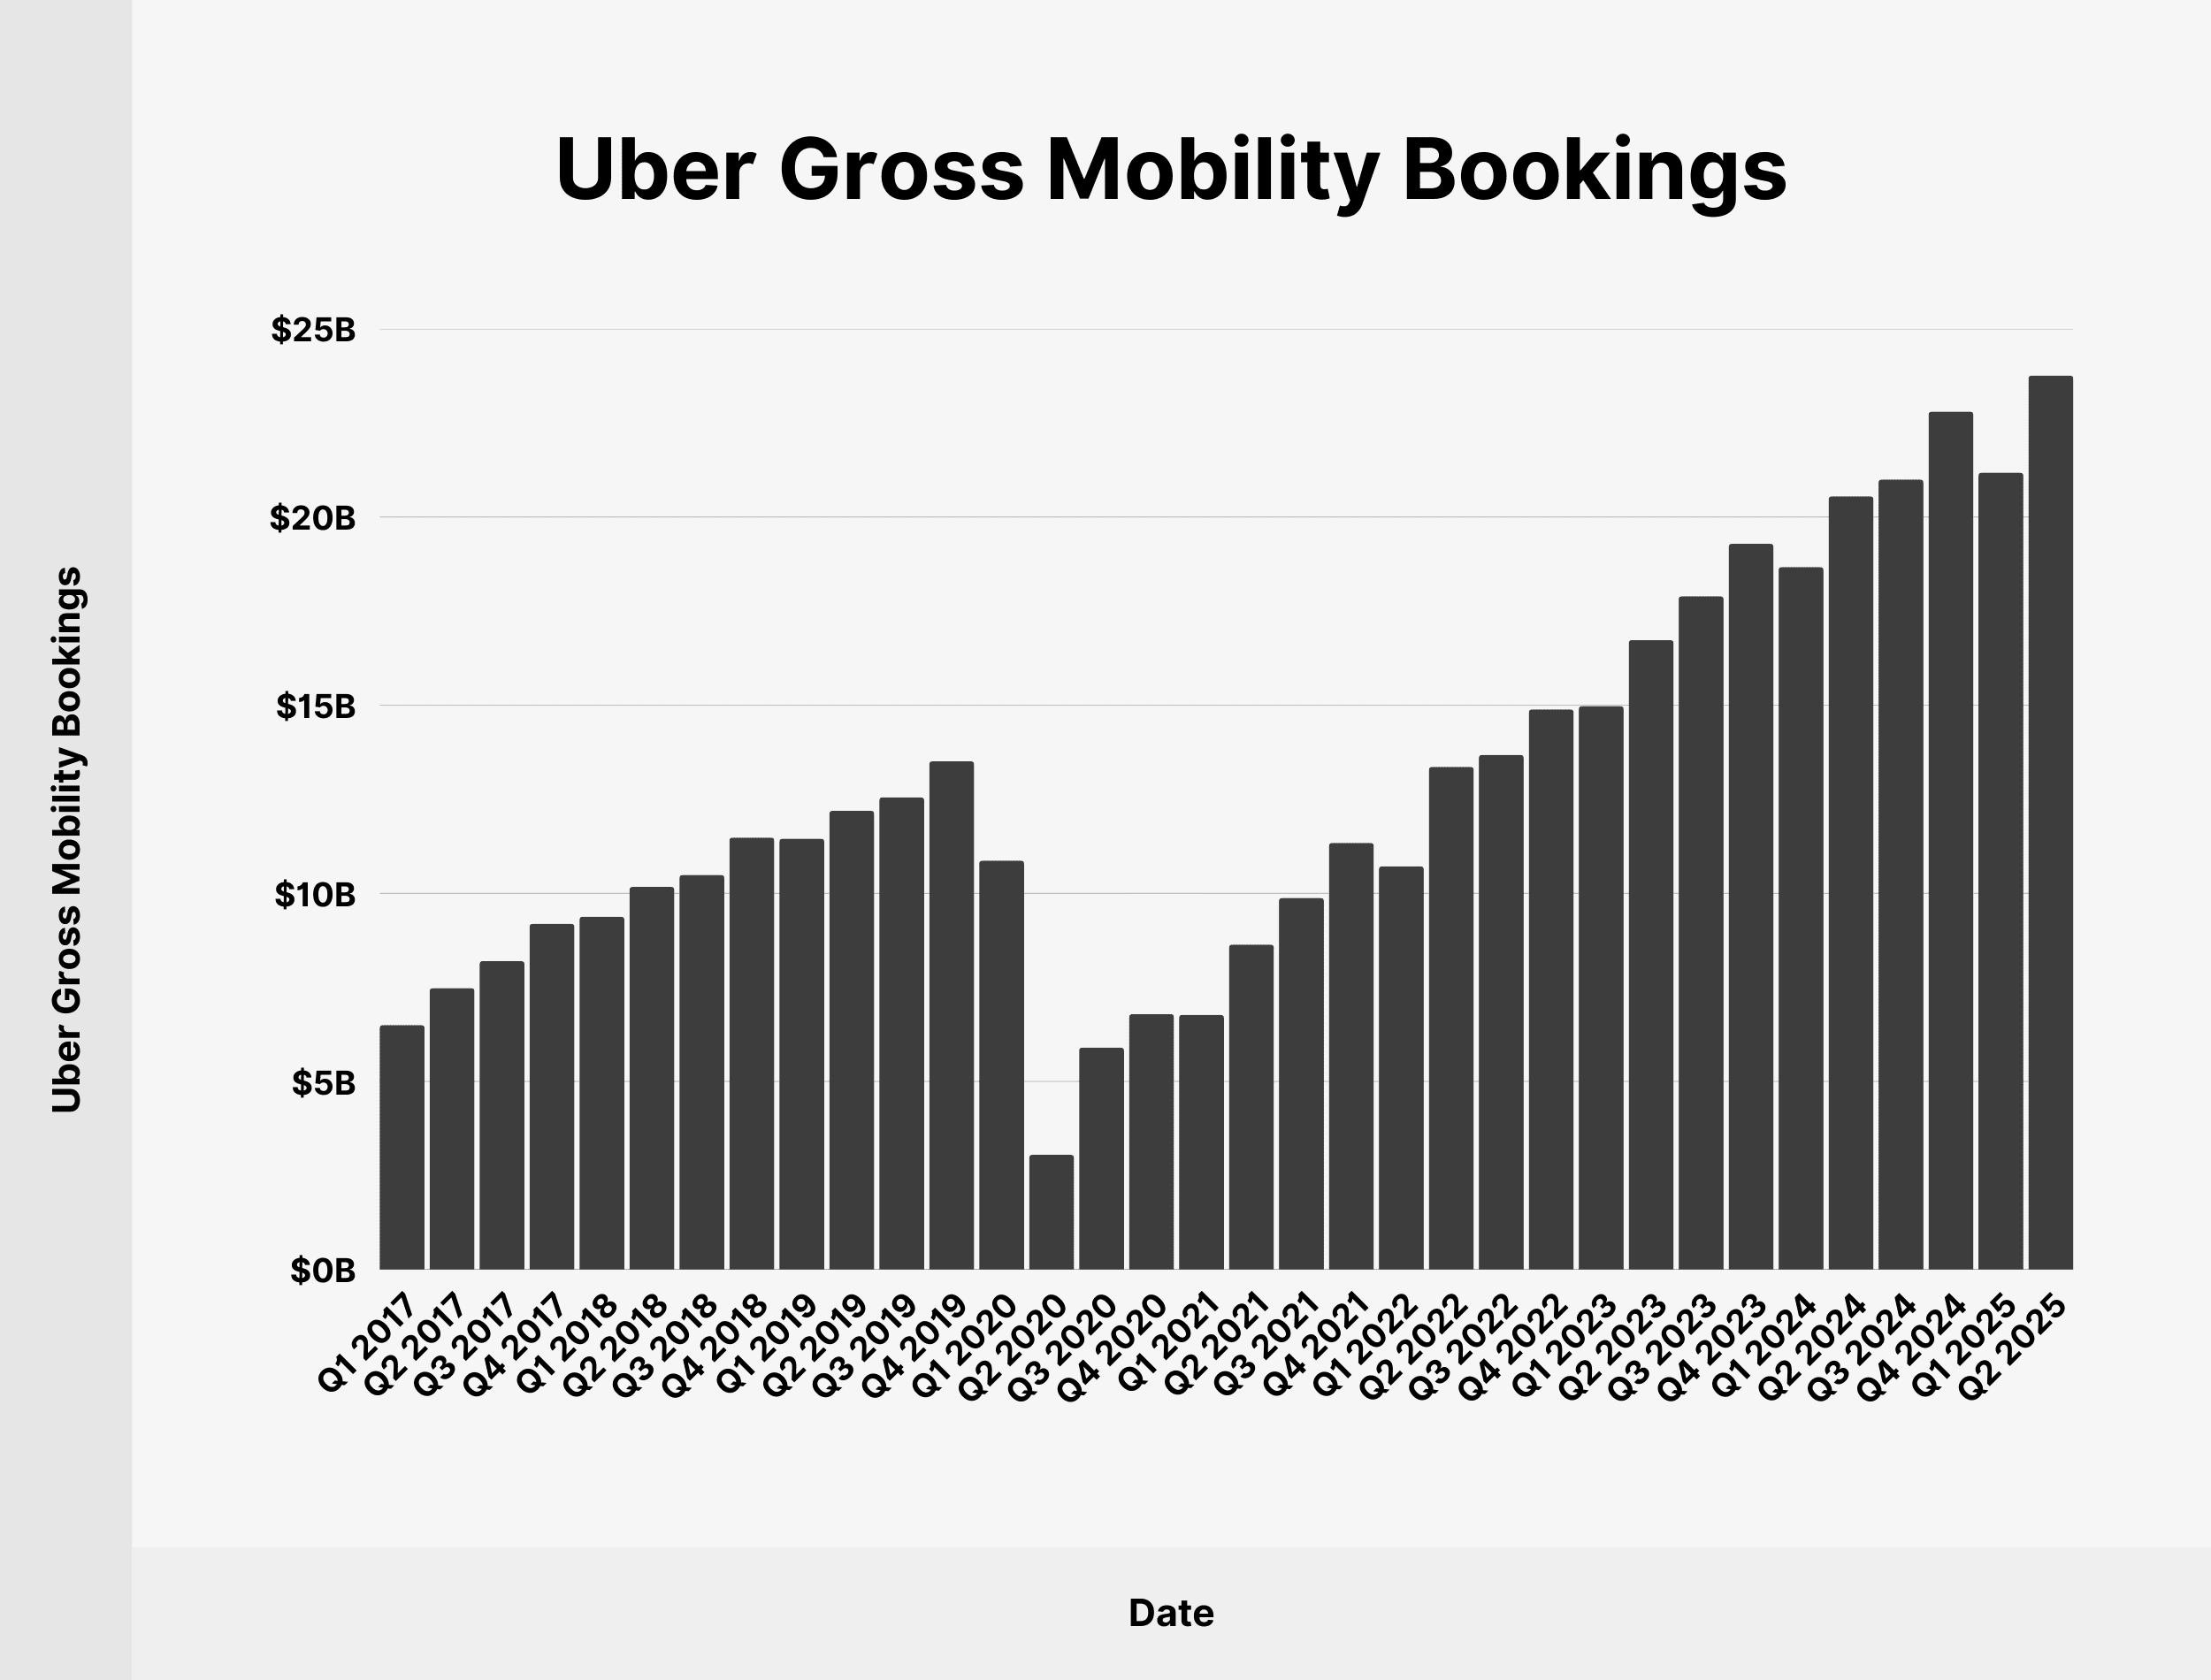
Bookings across all Uber segments totaled $46.76 billion in Q2 2025, meaning rideshares accounted for 50.82% of the total gross transaction value.
Below is a table showing Uber’s gross mobility bookings since 2017:
| Date | Uber Gross Mobility Bookings |
|---|---|
| Q1 2017 | $6.5 billion |
| Q2 2017 | $7.48 billion |
| Q3 2017 | $8.2 billion |
| Q4 2017 | $9.19 billion |
| Q1 2018 | $9.38 billion |
| Q2 2018 | $10.17 billion |
| Q3 2018 | $10.49 billion |
| Q4 2018 | $11.48 billion |
| Q1 2019 | $11.45 billion |
| Q2 2019 | $12.19 billion |
| Q3 2019 | $12.55 billion |
| Q4 2019 | $13.51 billion |
| Q1 2020 | $10.87 billion |
| Q2 2020 | $3.05 billion |
| Q3 2020 | $5.9 billion |
| Q4 2020 | $6.79 billion |
| Q1 2021 | $6.77 billion |
| Q2 2021 | $8.64 billion |
| Q3 2021 | $9.88 billion |
| Q4 2021 | $11.34 billion |
| Q1 2022 | $10.72 billion |
| Q2 2022 | $13.36 billion |
| Q3 2022 | $13.68 billion |
| Q4 2022 | $14.89 billion |
| Q1 2023 | $14.98 billion |
| Q2 2023 | $16.73 billion |
| Q3 2023 | $17.9 billion |
| Q4 2023 | $19.29 billion |
| Q1 2024 | $18.67 billion |
| Q2 2024 | $20.55 billion |
| Q3 2024 | $21 billion |
| Q4 2024 | $22.8 billion |
| Q1 2025 | $21.18 billion |
| Q2 2025 | $23.76 billion |
Source: Uber
Uber Trips
Uber had 3.27 billion trips in Q2 2025.
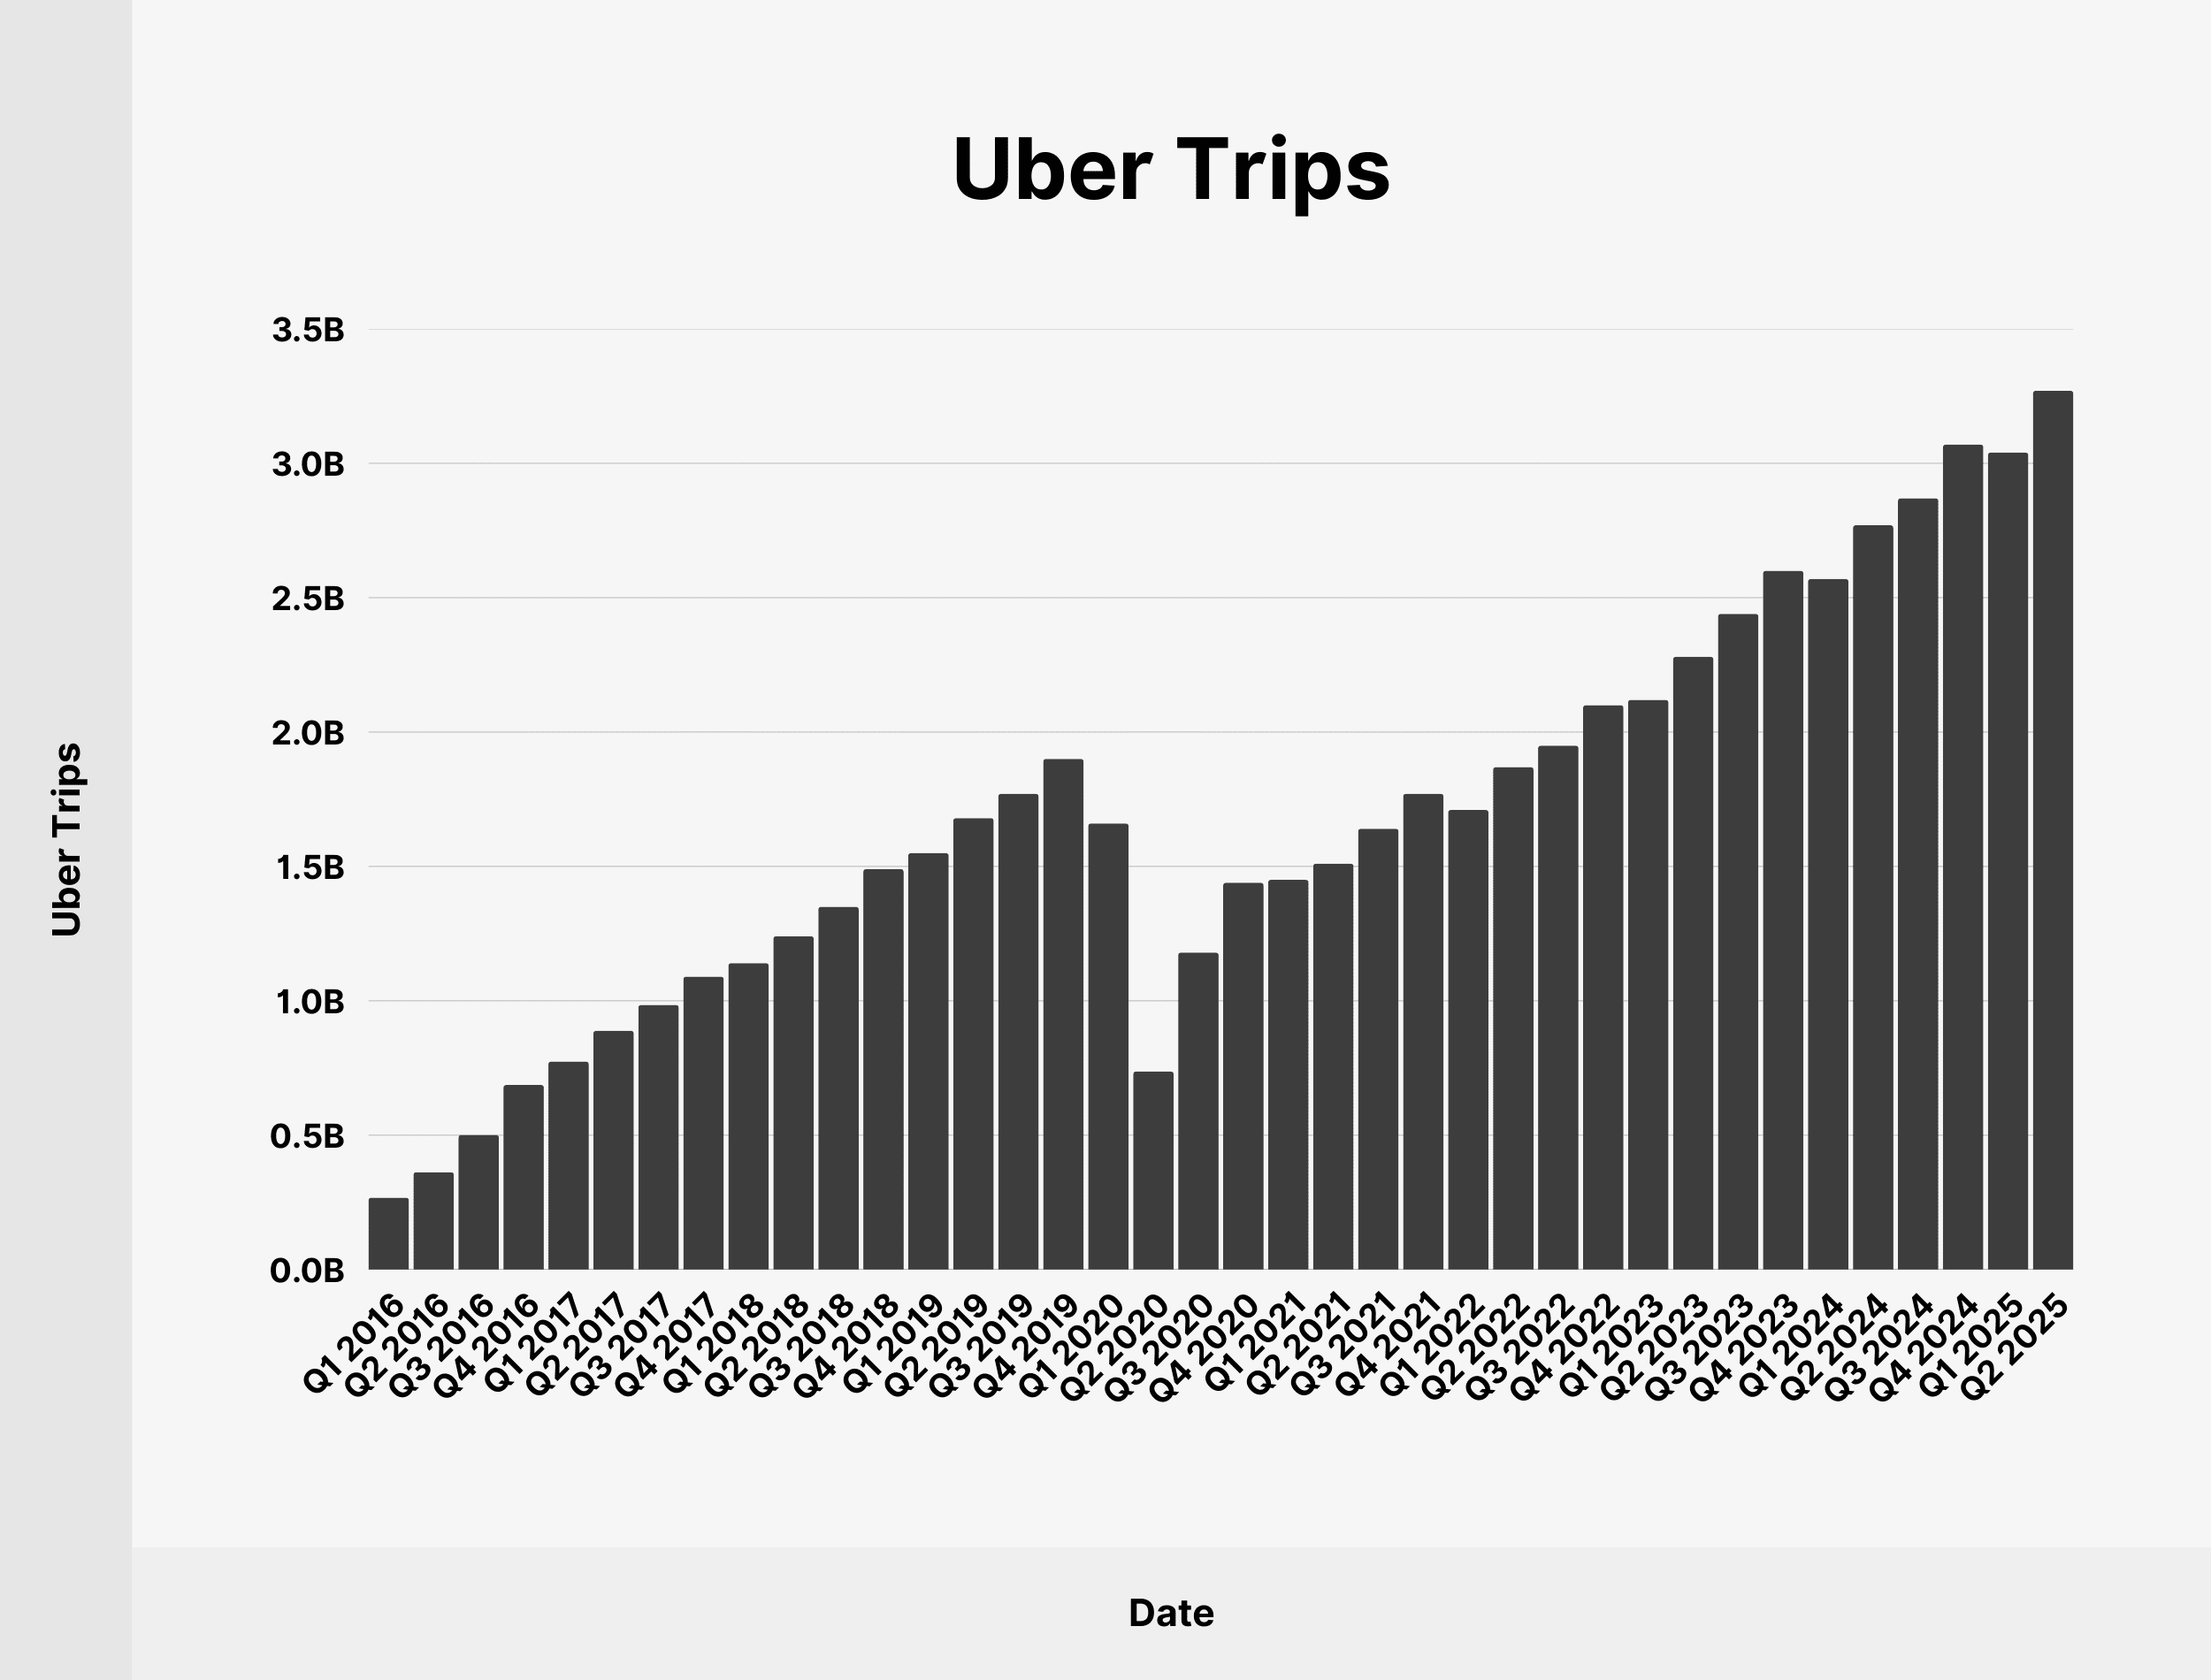
(“Trips” refers to any completed ride or delivery organized through the platform.)
Uber crossed the 2 billion quarterly trips milestone at the end of 2022.
Here’s a table with the number of quarterly trips on Uber since 2016:
| Date | Uber Trips |
|---|---|
| Q1 2016 | 268 million |
| Q2 2016 | 362 million |
| Q3 2016 | 501 million |
| Q4 2016 | 687 million |
| Q1 2017 | 774 million |
| Q2 2017 | 889 million |
| Q3 2017 | 985 million |
| Q4 2017 | 1.09 billion |
| Q1 2018 | 1.14 billion |
| Q2 2018 | 1.24 billion |
| Q3 2018 | 1.35 billion |
| Q4 2018 | 1.49 billion |
| Q1 2019 | 1.55 billion |
| Q2 2019 | 1.68 billion |
| Q3 2019 | 1.77 billion |
| Q4 2019 | 1.9 billion |
| Q1 2020 | 1.66 billion |
| Q2 2020 | 737 million |
| Q3 2020 | 1.18 billion |
| Q4 2020 | 1.44 billion |
| Q1 2021 | 1.45 billion |
| Q2 2021 | 1.51 billion |
| Q3 2021 | 1.64 billion |
| Q4 2021 | 1.77 billion |
| Q1 2022 | 1.71 billion |
| Q2 2022 | 1.87 billion |
| Q3 2022 | 1.95 billion |
| Q4 2022 | 2.1 billion |
| Q1 2023 | 2.12 billion |
| Q2 2023 | 2.28 billion |
| Q3 2023 | 2.44 billion |
| Q4 2023 | 2.6 billion |
| Q1 2024 | 2.57 billion |
| Q2 2024 | 2.77 billion |
| Q3 2024 | 2.87 billion |
| Q4 2024 | 3.07 billion |
| Q1 2025 | 3.04 billion |
| Q2 2025 | 3.27 billion |
Source: Uber
Uber Mobility Revenue
Uber takes a “service fee” cut from each ride booked through the platform.
The mobility (ridesharing) segment of the business generated $13.78 billion in revenue in the first 6 months of 2025, showing a 17.14% year-over-year increase.
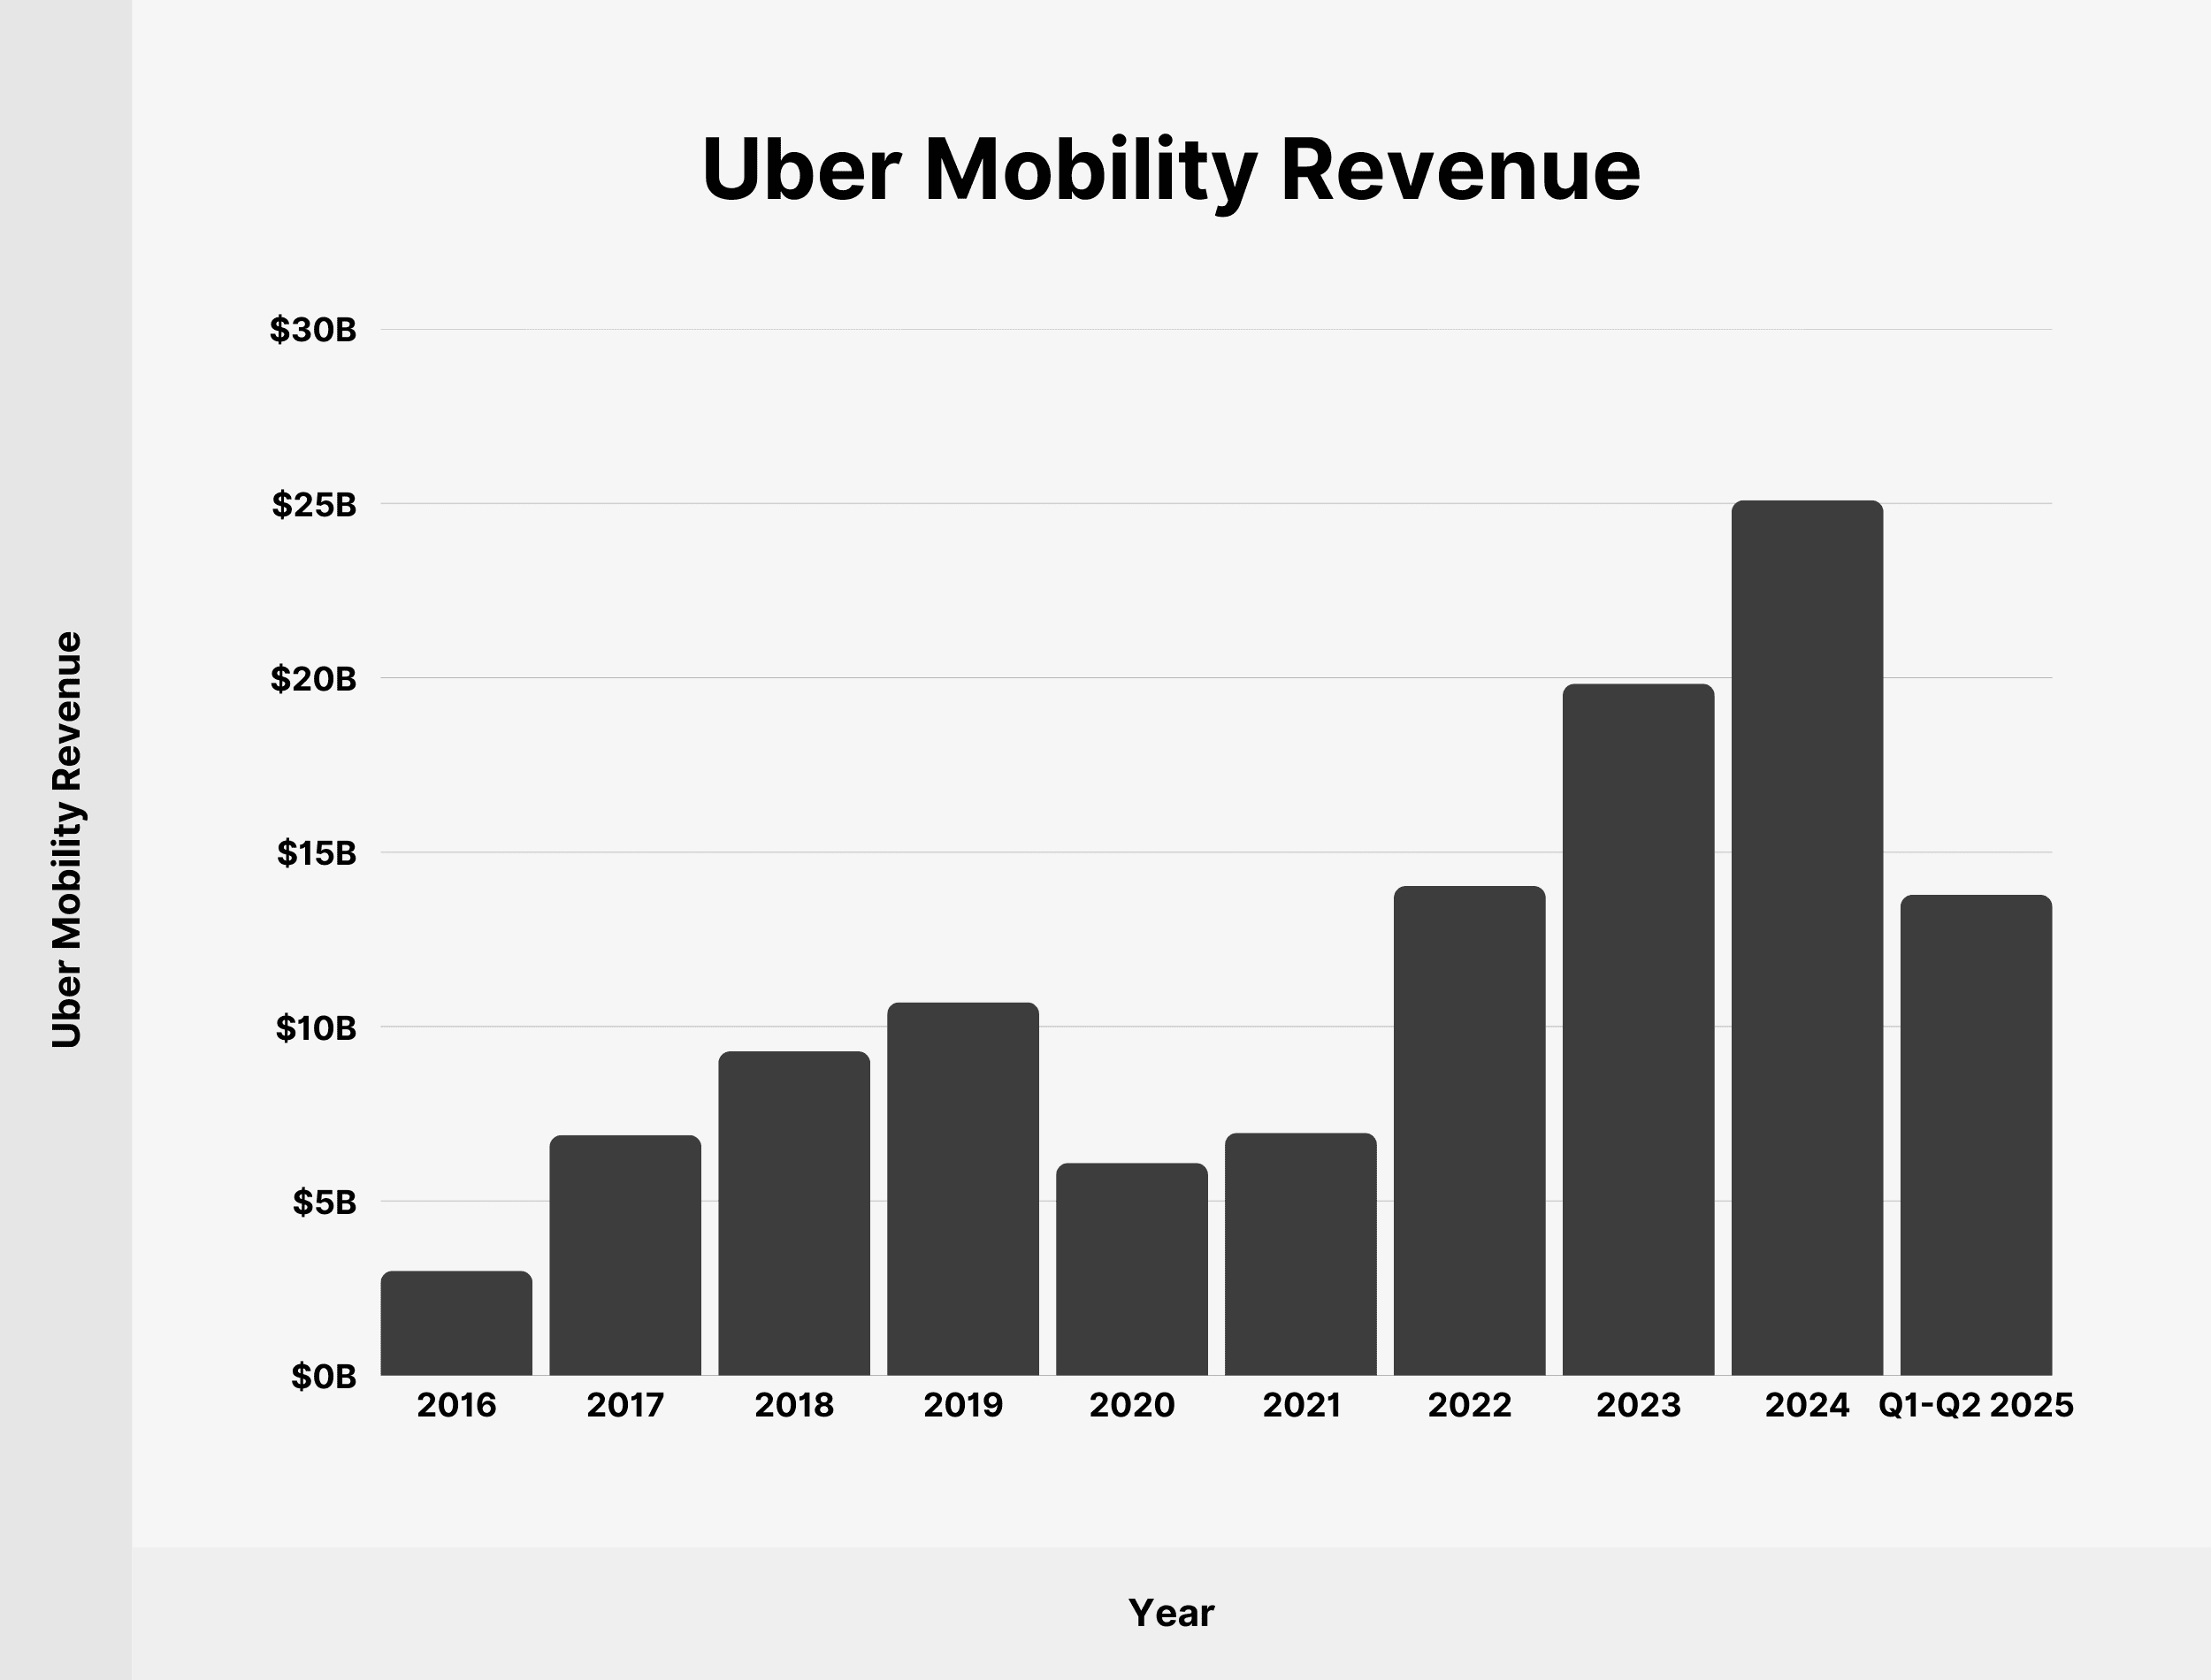
Here’s a table showing Uber’s annual revenue from the mobility segment since 2016:
| Year | Uber Mobility Revenue |
|---|---|
| 2016 | $3 billion |
| 2017 | $6.89 billion |
| 2018 | $9.29 billion |
| 2019 | $10.7 billion |
| 2020 | $6.09 billion |
| 2021 | $6.95 billion |
| 2022 | $14.03 billion |
| 2023 | $19.83 billion |
| 2024 | $25.09 billion |
| Q1-Q2 2025 | $13.78 billion |
Source: Uber
What Is Uber’s Share of the US Rideshare Market?
In March 2024, Uber had a 76% market share of the US ride-hailing market. Uber’s market share peaked as high as 91% in 2015 and has declined ever since.

We’ve charted Uber’s market share in the US since 2015:
| Date | Uber US Market Share |
|---|---|
| January 2015 | 91% |
| July 2015 | 91% |
| January 2016 | 87% |
| July 2016 | 84% |
| January 2017 | 82% |
| July 2017 | 75% |
| January 2018 | 71% |
| July 2018 | 71% |
| April 2019 | 69% |
| July 2020 | 70% |
| January 2021 | 68% |
| September 2021 | 68% |
| January 2022 | 71% |
| May 2022 | 72% |
| May 2023 | 75% |
| November 2023 | 76% |
| February 2024 | 76% |
| March 2024 | 76% |
Sources: Second Measure, Vox
Uber US Users
As of 2025, Uber has 61.5 million users in the US who use the app for transportation services, up from 58.6 million in 2024.
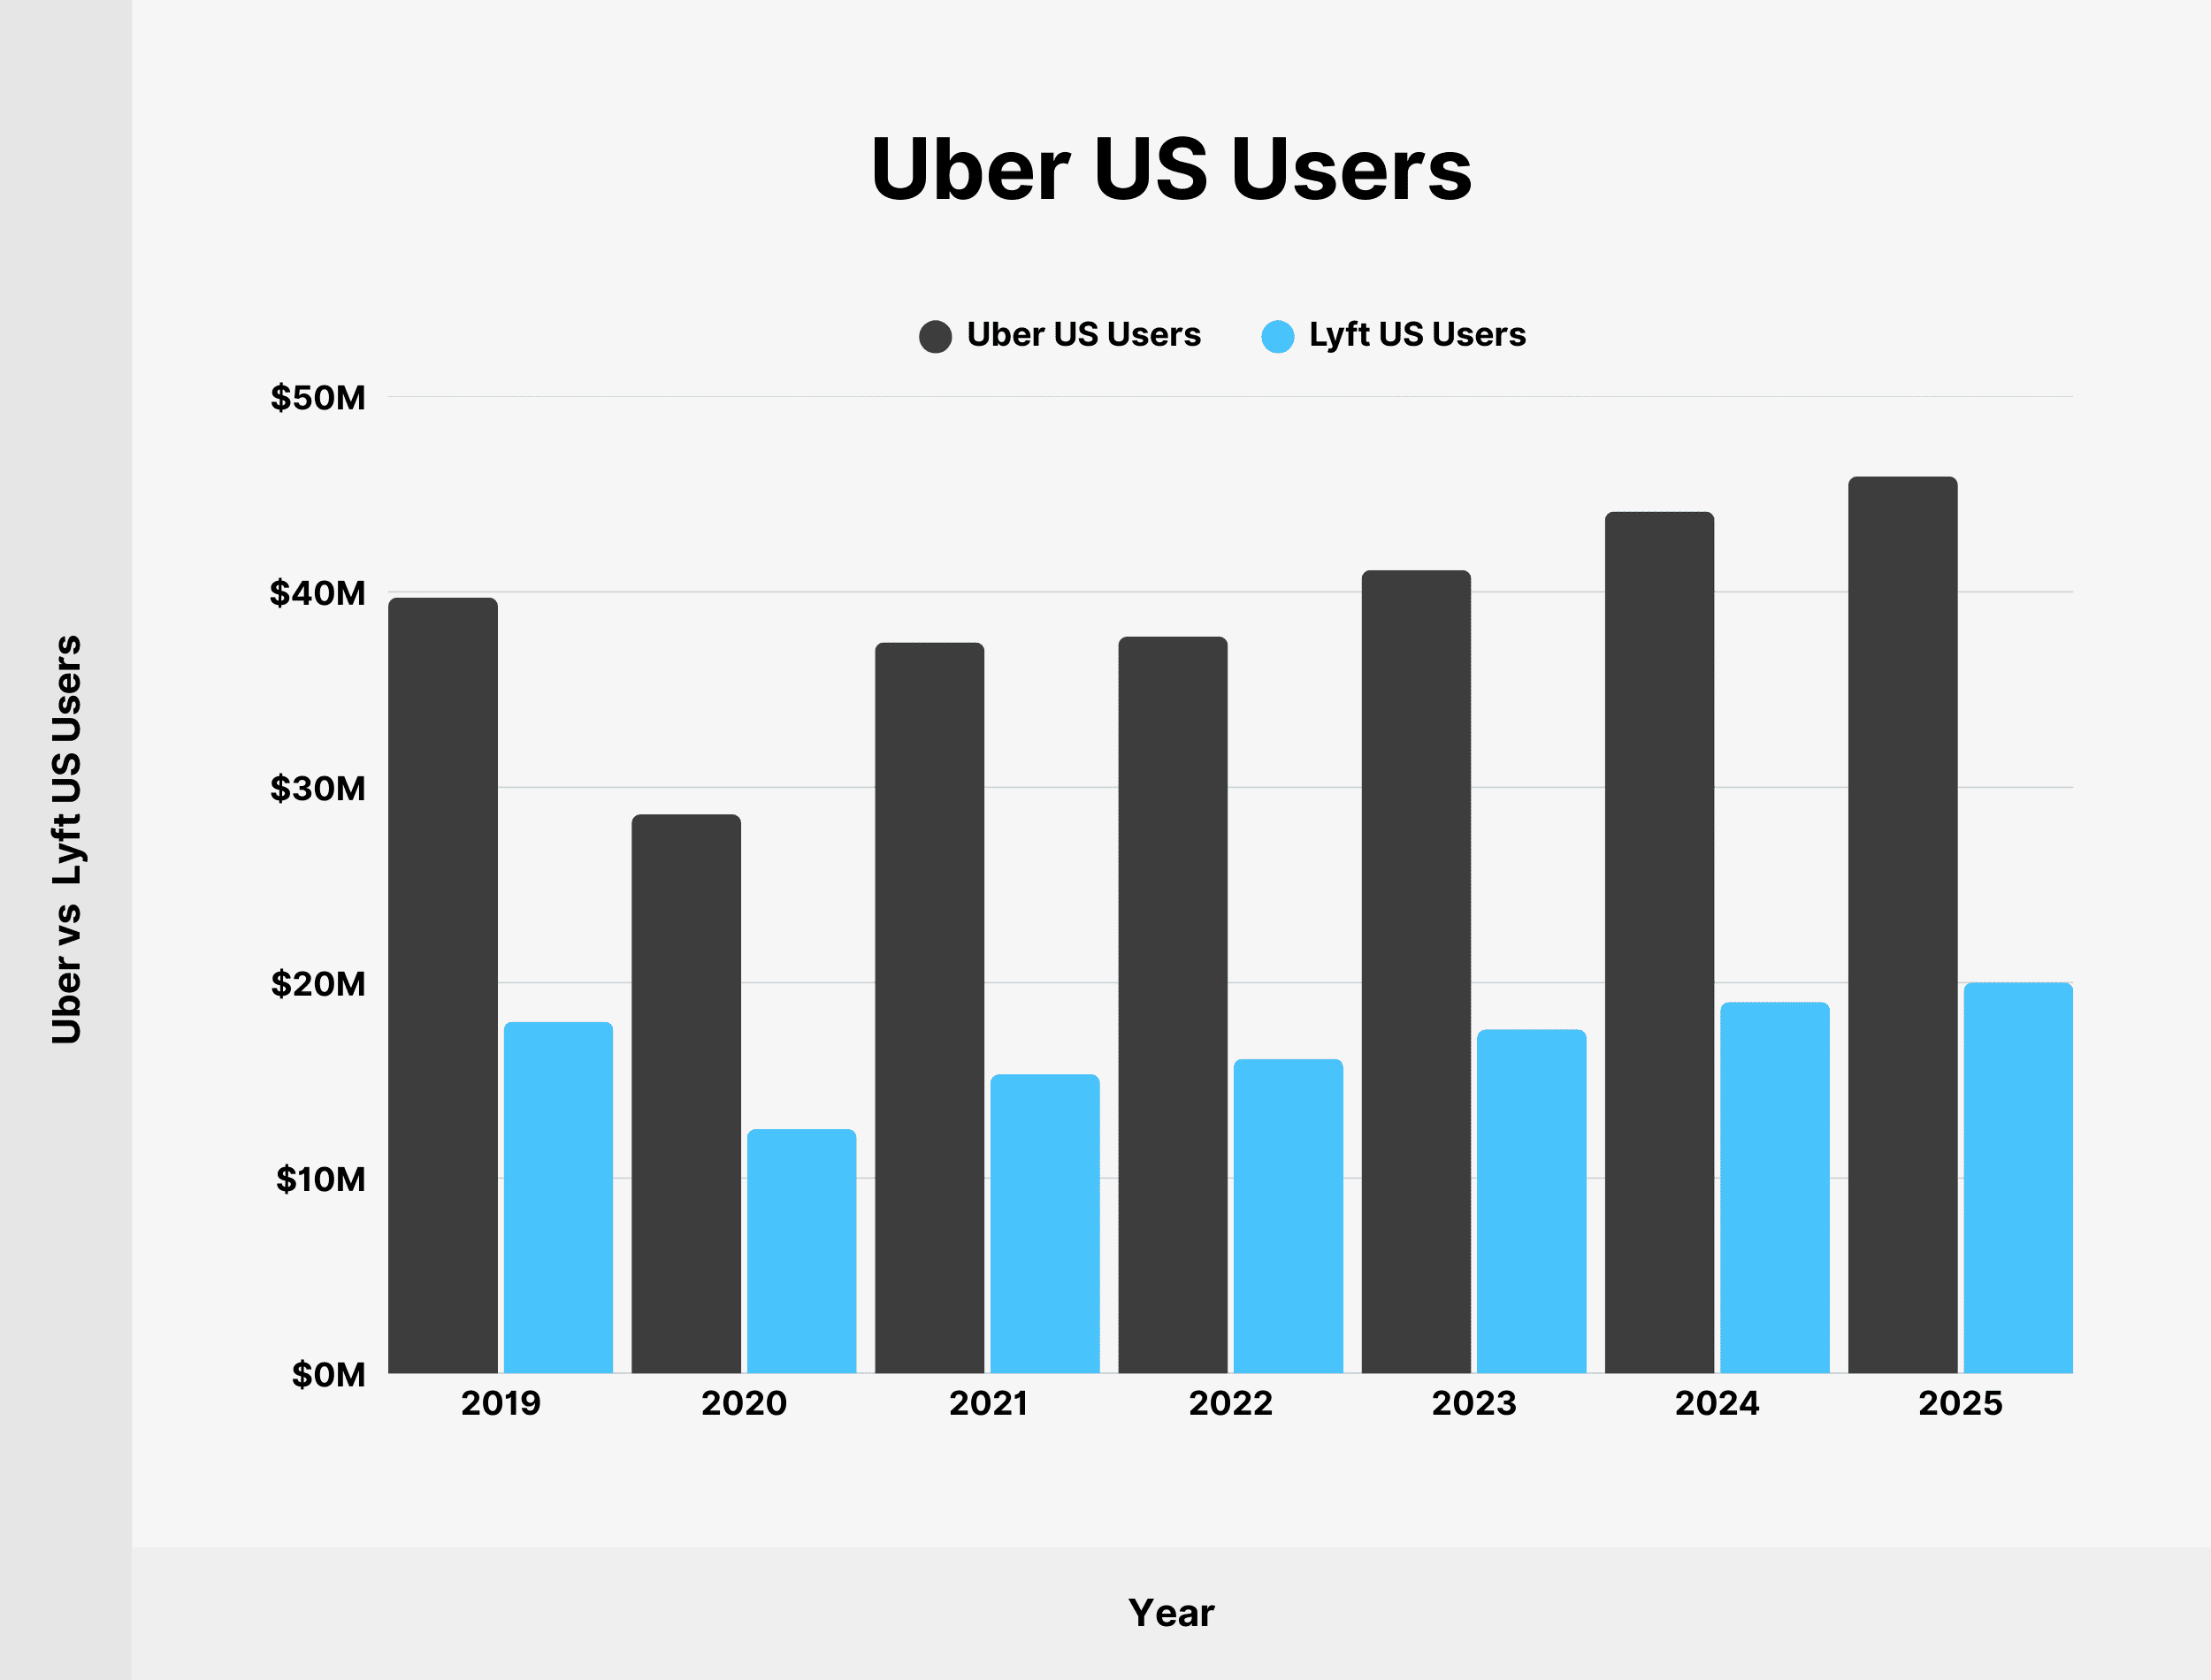
Here’s a detailed breakdown of Uber users in the US since 2019:
| Year | Uber US Users | Lyft US Users | Both |
|---|---|---|---|
| 2019 | $39.7 million | $18.0 million | $14.0 million |
| 2020 | $28.6 million | $12.5 million | $5.8 million |
| 2021 | $37.4 million | $15.3 million | $8.9 million |
| 2022 | $37.7 million | $16.1 million | $11.6 million |
| 2023 | $41.1 million | $17.6 million | $13.3 million |
| 2024 | $44.1 million | $19.0 million | $14.5 million |
| 2025 | 45.9 million | $20.0 million | $15.6 million |
Source: eMarketer
How Many Uber Drivers Are There?
In Q2 2025, Uber had 8.8 million drivers and couriers on the platform. The driver pool has increased by 14.7% from 7.4 million drivers and couriers in Q2 2024.

Here’s a detailed breakdown of Uber drivers and couriers since Q1 2023:
| Date | Uber Drivers and Couriers |
|---|---|
| Q1 2023 | 5.7 million |
| Q2 2023 | 6 million |
| Q3 2023 | 6.5 million |
| Q4 2023 | 6.8 million |
| Q1 2024 | 7.1 million |
| Q2 2024 | 7.4 million |
| Q3 2024 | 7.8 million |
| Q1 2025 | 8.5 million |
| Q2 2025 | 8.8 million |
Source: Uber
Uber Membership
Uber offers paid subscription memberships (Uber One, Uber Pass, Rides Pass, and Eats Pass) which offer benefits on rides and deliveries.
As of June 2025, Uber had over 36 million members who account for over 40% of gross bookings on the platform.
Source: Uber
How Many People Work at Uber?
According to the latest company update, Uber has 31,100 employees around the world. 18,000 Uber employees (57.88%) are based outside of the United States.

The median base salary of Uber employees on an H1-B visa is $184,950.
Sources: Uber, H1B Salary Database
Conclusion
You’ve reached the end of my list of Uber stats for 2025.
Hopefully, you now have a better understanding of Uber’s ride-sharing business. It will be interesting to follow whether Uber will stay dominant in the ridesharing market and how it will handle increasing regulatory challenges.
Backlinko is owned by Semrush. We’re still obsessed with bringing you world-class SEO insights, backed by hands-on experience. Unless otherwise noted, this content was written by either an employee or paid contractor of Semrush Inc.

